Contents
Konstantin Loshadkin, Anastasia Mikhailova,
Elena Arabova
in Sustainable Resource Use
Moscow State University)
ACKNOWLEDGEMENTS
The creative process is of course the prerogative of the authors. However, the outcome of this process could not have been as complete and as thoughtful without the knowledge and experience of people whose invaluable contribution helped to make the process meaningful, exact and relevant to readers. Our vision of the spatial development of the System of Environmental-Economic Accounting (SEEA) and the related synthesis of concepts and ideas has taken shape since the mid-1990s. Over these years we have had the good fortune to take part in discussions of crucial scientific approaches to the evolution of modern information systems in the relationship between Society and Nature together with authors and academics. We therefore believe that it is important to mention those who have contributed to creating this treatise and bringing it to readers.
We would like to express special thanks to:
Anil MARKANDYA, one of the creators of the concept of the “green” economy. 20 years ago he helped us to master SEEA approaches and methods for applying findings to improve environmental management and regional sustainability. We continue to draw on his forward-looking ideas and to attempt to put them into practice.
Nikolai LUKIANCHIKOV, an outstanding economist in the field of environmental economics, the last Deputy Minister of Ecology and Environmental Management of the USSR, who contributed much to introducing the basic principles of integrated environmental-economic accounting in Russia.
Budimir POYARKOV, who suggested the idea of integrated territorial cadasters of natural resources based on diligent attention to regional and local levels of management.
Henrietta PRIVALOVSKAYA, leader of environmental research in the field of economic geography in Russia who has contributed greatly to the development of our team. Her participation in profound and many-sided discussions helped to clarify and articulate the foundations of our understanding of the territorial synthesis of economic and environmental information.
Konstantin GOFMAN, whose short but highly meaningful and unforgettable talks in the early 1990s on various issues of environmental economics extended our horizons and helped us to embrace various methodological aspects of monetary estimates of environmental resources.
Sergei BOBYLEV, who provided valuable advice on the measurement of sustainable development and economic growth and supported our research in every way.
Renat PERELET, who introduced us to the theory of sustainable development in the early 1990s. and whose friendly support through the last two decades has been of inestimable value.
Vladimir ZAKHAROV, with whom we have had valuable interchanges regarding environmental health and the importance of the Earth Charter.
Miriam LINSTER, who offered numerous timely and highly fruitful recommendations on creating and developing green economy and green growth indices, drawing on OECD expertise.
Vim COFINO for insightful discussions on philosophy and sustainability measurement.
Alexander DUMNOV for valuable consultations on the basic methodology of environmental statistics and specifics of environmental-economic accounting.
Alexander LYUTY, whose “language of maps” helped us finalize the methodological basis for creating behavioral maps integrated with the SEEA and formulating map legends with a focus on sustainable resource use and environmental protection.
We are also grateful to Yuli Lipets, Valery Pulyarkin, Enrid Alayev, Luisa Nochevkina, Vladimir Streletsky, Andrei Treivish, Irina Volkova, Tatyana Runova, Hans-JürgenTaurit, Lev Knyazkov and many other colleagues for their sympathetic and deep discussion of numerous ideas in the course of informal meetings.
At various stages of the work our research was supported by leading experts of the Russian Ministry of Natural Resources and Environmental Protection, the Federal Service for National Statistics, Federal Service for Supervision of Natural Resources, as well as regional and municipal administrations in Kaliningrad, Kaluga, Kemerovo, Kostroma, Nizhny Novgorod, Ryazan, Saratov, Tomsk, Yaroslavl, Kamchatka and Krasnoyarsk Regions, the Republics of Buryatia, Karelia and other subjects of the Russian Federation.
Our understanding of the SEEA principles was greatly expanded by regular participation in meetings on environmental statistics and environmental-economic accounting held by UNECE (Lidia Bratanova, Tiina Luigi, etc.), the UN Department for Statistics and the OECD, where we have refined our views of statistical environmental systems over a period of nearly 10 years.
Our special thanks to Andrey Tatarinov, Natalia Shashlova, Marina Klevakina, Galina Romashkina, Mikhail Gordonov, Alexander Averchenkov, Anatoliy Shevchuk, Olga Medvedeva, Arkady Tishkov, Alexander Adam, Alexander Golub, Alla Shvets, Vladimir Revezensky, Mikhail Buyanov, Elena Bondarchuk, Valery Panov, Margarita Tsibulnikova, Vladimir Morozov and many others for their expert assistance at various stages of the research, on which the conclusions of this book are based.
ABBREVIATIONS
GDP – Gross Domestic Product
GRP – Gross Regional Product
WTO – World Trade Organization
CEA – Classification of Environmental Activities
IAEA – International Atomic Energy Agency
RVM – Residual Value Method
ISIC – International Standard Industrial Classification of all Economic Activities
IEA – International Energy Agency
UN – United Nations
SPA – Special Protection Area
OECD – Organization for Economic Cooperation and Development
SNA – System of National Accounts
EPEA – Environmental Protection Expenditure Accounts
SEEA – System of Environmental-Economic Accounting
SEEA-W – System of Environmental-Economic Accounting for Water
SDG – Sustainable Development Goals
NDP – Net Domestic Product
NPV – Net Present Value
SEIS – Shared Environmental Information System
GLOSSARY
Asset is a store of value representing a benefit or series of benefits accruing to the economic owner by ownership or use of the asset over a period of time. It is the means of transferring value from one accounting period to another (Central Framework for the SEEA. UN, 2012).
Man-made (physical) capital includes man-made means of production, such as machines, buildings, production infrastructure, which are involved in the production process without being materialized in the final product (Renat Perelet. Systems Management of Transition to Sustainable Development, 2009).
Return on Produced Assets is the income from the use of produced assets in the process of production after deduction of the fixed capital consumed in this process (Central Framework for the SEEA, UN, 2012).
Return on Environmental Assets is the income attributable to the use of environmental assets in the production process after deducing all costs of extraction including any costs of depletion of natural resources (Central Framework for the SEEA. UN, 2012).
Living System is a multiple interconnected network whose components continually change, are transformed and are replaced by other components. The network is characterized by exceptional flexibility and fluidity, which enables the system to respond in a specific way to disturbances or “stimuli” coming from the environment (Capra, F. The Web of Life. A New Scientific Understanding of Living Systems. Moscow: Sofia Publishing House, 2003).
Green Economy is the economy, which serves to improve human well-being and social equity, while significantly reducing environmental risks and ecological scarcities. The green economy is a system of economic activities related to the production, distribution and consumption of goods and services, which results in long-term improvement of human well-being without exposing future generations to significant environmental risks and ecological deficits; it is environmentally harmless, eco-friendly and socially fair (Towards a Green Economy: Pathways to Sustainable Development and Poverty Eradication. UNEP, 2011).
Green Growth involves fostering economic growth and development while ensuring that natural assets continue to provide the resources and environmental services on which our well-being relies. This is achieved by catalyzing investment and innovation to underpin sustained growth and create new economic opportunities (Towards Green Growth. A Summary for Policy Makers. OECD, 2011).
Inclusive Growth is a new approach to understanding economic growth, focused on improving living standards and achieving more equitable distribution among social groups of benefits from increased well-being (All on Board. Making Inclusive Growth Happen. OECD, 2014).
Institutional Unit is an economic entity that is capable, in its own right, of owning assets, incurring liabilities and engaging in transactions and other economic activities with other entities (Central Framework for the SEEA. UN, 2012).
Use of Natural Resources is the exploitation of natural resources, their transfer to economic activity, including any way of affecting them in the process of economic or other activity (Federal Law of 10.01.2002 No. 7-FZ (as amended on 29.12.2015) “On Protection of the Environment”).
Cultivated Biological Resources include animal resources yielding products on a regular basis, as well as timber, crop and plant resources yielding repeat products on a regular basis, whose natural growth and regeneration are under the direct control, responsibility and management of an institutional unit (Central Framework for the SEEA, UN, 2012)
Best Available Technology is a technological process or technical method based on advanced scientific and technical achievements, which is aimed at reducing negative environmental impact of economic activities and has an established service life with due account for economic, technical, ecological and social factors (Amendment No.1 GOST P 521004-2003 Resource Saving Terms, Definitions approved by Rosstandart Order of 30.11.2010 No.756-st)
Negative Environmental Impact is the effect of economic and other activities resulting in negative changes in the environment (Federal Law of 10.01.2002 No.7- FZ (as amended on 29.12.2015) “On Protection of the Environment”).
Non-Produced Assets are assets that have come into existence in ways other than through processes of production. (Central Framework for the SEEA, UN, 2012).
Environment is a complex of the components of the natural environment, natural, and part-natural, part-man-made objects as well as man-made objects (Federal Law of 10.01.2002 No. 7-FZ (as amended on 29.12.2015) “On Protection of the Environment”).
Fixed Assets are produced assets that are used repeatedly or continually in production processes over a period longer than one year. (Central Framework for the SEEA. UN, 2012)
Natural Resources are components of the natural environment, natural objects and part natural-part man-made objects which are used or can be used in economic or other activities as energy sources, production outputs and for consumption, and which have consumption value. (Federal Law of 10.01.2002 No.7-FZ (as amended on 29.12.2015 “On Protection of the Environment”).
Environmental Capital (in terms of the theory of economic growth) is the aggregate of natural resources, which can be used in production processes. Any environmental asset creating a flow of eco-services with economic value is environmental capital (Dictionary of Sustainable Development Terms, http://www.ustoichivo.ru)
Environmental Institutions are the “rules of the game” in a society, a certain framework of limitations that organize relations between individuals with due account for environmental factors. Such institutions are the products of collective effort; they generate incentives that induce people to comply with environmental restrictions and regulations. They reduce uncertainty by structuring everyday life or, in other words, they determine or limit the range of alternatives available to each individual in his or her relations with the natural environment. Environmental institutions make the behavior of people and communities in the environmental sphere more predictable, reducing the probability of destructive behavior and conflicts caused by it (Fomenko, G.A. Environmental Management: A Socio-Cultural Methodology. Institute for Sustainable Innovation, San Jose, 2017)
Produced Assets are assets that have come into existence as outputs of processes that fall within the production boundary of the SNA. (Central Framework for the SEEA. UN, 2012)
System of National Accounts is an internationally coordinated standard set of recommendations to measure indicators of economic activities in accordance with strict rules of accounting and reporting at the macro level based on the principles of economic theory (System of National Accounts 2008. New-York, 2012 p. 64)
System of Environmental-Economic Accounting is a multipurpose conceptual framework for describing the interaction between the economy and the environment and the stocks and changes in stocks of environmental assets. (Central Framework for the SEEA. UN, 2012)
Bifurcation Point is a critical state of the system when the system becomes unstable in respect of fluctuations and uncertainty arises whether the state of the system will become chaotic or whether it will ascend to a new, more differentiated and elevated level of regularity (Muzika, O.A. Bifurcation in Nature and Society: Natural-Science and Socio-Synergetic Aspect // Modern High Technologies 2011. №1 С. 87-91).
Sustainable Productivity is an excessive or surplus quantity of animals or plants, which can be absorbed from the population without affecting the capacity of this population for self-reproduction. (Central Framework for the SEEA. UN, 2012)
Sustainable Development is development, which can meet the needs of the present generation without undermining the ability of future generations to meet their own needs (Our Common Future. Report of the International Committee on Environment and Development. 1987. Moscow: Progress, 1989)
Vulnerability of Environmental Systems is the inability of environmental systems (biological communities, landscapes, etc.) to withstand the impact of external forces (any forces, although man-made effects are of special significance). Vulnerable environmental systems can be easily disturbed; they can lose their structure and function, and may be rearranged in a harmful way (Malashevich Ye.V. Short Reference Dictionary on Environmental Protection. Minsk, 1987)
Environmental Assets are the naturally occurring living and non-living components of the Earth, together constituting the biophysical environment, which can provide benefits to humanity (Central Framework for the SEEA. UN, 2012)
Environmental Risk is the probability of occurrence of an event having unfavorable consequences for the natural environment, caused by negative impact of economic or other activities, or by emergencies of an environmental or man-made character (Federal Law of 10.01.2002 No. 7-FZ (as amended on 29.12.2015) “On Environmental Protection”).
Ecosystems are geographical locations that host a dynamic complex of plant, animal and microorganism communities and their inorganic environment, interacting as a functional whole to generate environmental structures, processes and functions (the Central Framework for the SEEA. UN, 2012)
Ecosystem Services are the functions of ecosystems in providing benefits to the users of such services through the natural achievement of various kinds of regulating functions. Users of the services may be at local level (individual enterprises), or at regional or global level, including entire countries and regions (Convention on Biological Diversity – International Agreement adopted in Rio de Janeiro on June 5, 1992).1
FOREWORD
Unprecedented in terms of its historical importance, the adoption of universal global sustainable development goals (SDGs) has produced a corresponding demand for information and analytical support in achieving these goals.2 In instrumental terms, the comprehensive nature of SDGs requires a change in approaches to strategic environmental planning and program-oriented and goal-oriented management at all levels of territorial organization. In methodological terms, it means the enhancement of coverage and the goal-oriented shift of focus in addressing problems of territorial development at all stages of work with information resources, starting from data selection, generalization, analysis, interpretation and understanding, which, in fact, means a substantial change in approaches to creation and further development of information and analytical support. Alongside tackling data systematization and update challenges for the purposes of addressing management issues, a special emphasis should be placed on the goal-oriented synthesis of sustainable development and green economy indicators, environmental indicators and special socio-cultural measurements.
In our opinion, the nature of discussions around SDGs and how they can be achieved reflects the changes that are occurring in understanding of the use of natural resources and, more broadly, the very essence of nature, not only as a set of natural objects and resources but also in its system “integrity” (Cassirer, 2004). The importance of these discussions correlates with the fact that by the end of the 20th century, the “wholeness” of nature has been considerably rethought, primarily, in the context of phenomenological philosophy and sociology. Alfred Schütz submitted an important argument that a distinction must be drawn between nature as a discipline of natural sciences and nature as a “constructive element of the lifeworld” (Schutz, 2004). As a result, at the worldview level, it further justified the occurring changes in views on the reasonability of broad application, in the context of sustainable development, of the theory of utility and full economic value to natural resources and ecosystem services, which predetermined new information needs.
On the other hand, the adoption of the sustainable development goals (SDGs) itself has become possible due to the emergence and rapid development in the last years of instrumental methods for collecting and processing enormous amounts of empirical data (including those at the micro-level, including aggregation and disaggregation, various interpretations in accordance with the set objectives, etc.) accumulated by behavioral and social sciences and representing the characteristics of the described essences for the purpose of their identification, search, assessment and management (American Library Association, 1999).
The key problem of environmental and economic measurements is that of measuring the sustainability of the use of natural resources (which, in fact, this book is addressing). We, the authors, proceed from the fact that the modern theory of sustainable development constitutes the most developed and acceptable methodological basis for maintaining Peace and preventing a global environmental disaster. Today, the System of Environmental-Economic Accounting (SEEA) provides the best way of measuring the key interactions between the economy and the environment.
As geographical scientists, we grew in the Russian cultural environment with its ambition for comprehensiveness and indivisibility of the world perception. These socio-cultural peculiarities of the vision (as well as the authors’ multifaceted work experience in management, production, design structures) allow perceiving naturally and to use the multidisciplinary approach to research that is quite productive in finding paths to sustainable development. It should be noted that our understanding of territorial planning and holistic accounting for natural resources and ecosystem services was formed by the Russian geographical school. It also must be mentioned that it was a good school of holistic territorial accounting for natural resources. However, behavioral specifics of communities, monetary relations, especially in the context of resource use preferences driven by socio-cultural factors, were significantly limited by the then dominating labor cost theory that hindered development of the behavioral economy and institutional geography.
In the early 1990s, it could be seen particularly well. The lack of monetary assessment of natural resources and the environment inherited from the state-planned and command system became one of the cornerstone problems of effective use of natural resources. In the new situation, when businesses no longer took into account the environmental and social requirements of territorial development of regions and settlements in locating their new manufacturing sites, the task of system accounting for natural resources to ensure multifaceted management and strategic planning of territorial development became more challenging.
Despite the economic difficulties in the Russian Federation, holistic environmental-economic accounting activities began in 1990s because information systems inherited from the state-planned and administrative system were set to collect information on key types natural resources and to address particular industrial issues. They did not allow conducting territorial analysis for comparing the real value of natural assets with income gained from their use, nor to conduct retrospective and forecasting research (including assessment of depletion of economically significant natural resources), nor to compare the value of various components of natural wealth (when planning investment). Moreover, the then existing information flows did not cover a wide range of natural resources; comparison of results was complicated due to the differences in collection, processing and visualization methods. Under such conditions, it is extremely difficult to justify and make effective management decisions on the multipurpose use, reproduction and protection of natural resources.
Our organization (Cadaster Institute), a scientific and production enterprise of cadasters of natural resources, was established by the Ministry of Environmental Protection and Natural Resources in the Russian Federation in 1992. Special attention in methodical and practical developments was paid to assessment of socially and environmentally dangerous exhaustibility due to extraction or quality deterioration of a resource as a result of economic activities (in physical and value, i.e. monetary, indicators); establishment of indicators of stocks and use of natural resources and ecosystem services not accounted in the existing statistical monitoring and departmental accounting systems; institutional aspects of the use of such indicators, including those driven by socio-cultural factors.
Today, we can identify the following stages of development of this area in the Russian Federation.
Stage One: the conduct of the federal experiment for improvement of accounting and socio-economic assessment of the natural resource potential (1993-1995). It was based on an attempt to develop and implement Integrated Territorial Natural Resources Inventories in environmental management practices. The experiment for developing Integrated Territorial Natural Resources Inventories was conducted under the guidance of the Ministry of Environmental Protection and Natural Resources of the Russian Federation in 35 constituent entities of the Russian Federation and was developing quite successfully. Two all-Russian meetings were conducted at the premises of Cadaster Institute in 1992 and 1994, where the experiment results were discussed.
Integrated Territorial Natural Resources Inventory was initially planned to contain data on natural resources in physical terms and could serve as a basis for their assessment in the structure of the regional and, ultimately, national system of environmental-economic accounting. Economic assessment was considered a necessary completing link in the system of holistic cadastral assessment of natural resources allowing inclusion of natural assets into assessment of economic activities. It was expected that such assessment would give an objective idea of the economic value of natural resources and allow justification of investment in their reproduction and protection and to select the most effective way of using such resources.3 In case of multipurpose use of natural resources, their monetary estimates could allow not only choosing how to use a particular resource (object) but also determining a strategy for sustainable use of the natural resource potential of the entire territory. Furthermore, they hoped that monetary estimates of natural resources could help optimize taxation of various types of natural resource use.
Stage Two: development of the regional environmental-economic accounting operations in accordance with the UN methodology (1996-2006). By that time, the flaws of the methodology of multipurpose territorial cadasters of natural resources had become apparent. They included the loss of the modern geographical science integrity: the unity of natural sciences and humanities in geography was split into many disciplines while physic-geographic and economic-geographic branches diverged substantially. Thus, in methodological terms, the very structure of measurements in the system Society-Nature that could allow creation of multifaceted geographical description within Integrated Territorial Natural Resources Inventory turned out to be weakly developed. During the development of Integrated Territorial Natural Resources Inventories, the static nature of most indicators reflected in them (stocks of natural resources, production, emissions and discharges, etc.) was discovered, which became an obstacle in analyzing the efficiency of regulation in natural resource use and environmental protection. The need has become obvious, not only in the system territorial approach allowing for economic comparison of natural resource use options but also in the dynamics — changes in raw material flows and ecosystem services, including in monetary terms.
Many other countries faced similar problems. It became possible to move forward owing to the System of National Accounts (SNA) and its satellite System of Environmental-Economic Accounting. The latter is a set of interrelated statistical indicators reflecting the state of natural capital (stocks, flows and other changes), allowing adequate determination of the value of natural resources and inclusion of it into the balance sheets of assets and liabilities within the framework of SNA. The System of Environmental-Economic Accounting is actively developing in many countries. A considerable contribution to establishment of the SEEA in the Russian Federation was made by the world-renowned scientist, Professor Markandya, one of creators of the very idea of “green economy” (Pearce, Markandya & Barbier, 1989); he personally consulted us during the initial stage of works in 1994-1999 (Fomenko, G., Fomenko, M., Markandya, & Perelet, 1997b). Development of the System of Environmental-Economic Accounting of the Yaroslavl Region should be deemed basic. As a result, based on the analysis of data on the availability and economic use of main natural resources (surface water, soil water collected from public water supply systems, ground water collected from wells, agricultural lands, timber and non-timber forest resources, recreational areas, hunting, fishing, mineral resources — sand and sand-gravel mix, bee resources), for the first time in Russia, the SEEA matrix was created, the amount of natural capital of the Yaroslavl Region was determined, the regional green GDP and NDP were calculated. As the research results has shown, the assessment of natural assets allows determination of the effectiveness of the current scenario of natural resource use (public water supply, forest, mineral resource complex, etc.) and to identify the most efficient areas of sustainable development.
Later, with the support of the Ministry of Natural Resources of the Russian Federation, the Federal Service for Supervision of Natural Resources Use and its territorial bodies as well as governmental and local self-regulation authorities of the Republic of North Ossetia-Alania, the Republic of Karelia, the Tomsk, Ryazan, Kaluga, Saratov, Kaliningrad and Kostroma Regions, the positive experience gained was used in other regions of the country. The emphasis was placed both on accounting for natural resources in physical terms and on economic assessment of natural resources. It was due to the extremely high role of the SNA/SEEA as a tool of analysis of socio-economic development in many countries.4
Not only did the results of regional research confirm practical applicability of the UN methodological principles of environmental-economic accounting in Russia and demand for obtained results in environmental management but also detected gaps in statistical and departmental information. First of all, it was the lack of indicators characterizing stocks and flows of natural resources (quantitative and qualitative aspects). Ineffectiveness of the territorial analysis based only on the “top-down” approach has become apparent. In the course of the works, it was supplemented by the “bottom-up” approach implying clarification of regional indicators of availability and actual consumption of natural resources at the municipal district level (starting from local settlements and private households, with further aggregation of this data at higher levels of territorial organization).
Stage Three: work activation at the federal level based on the territorial approach (2007-2011). At this stage, we conducted a pilot study to assess the possibility of application of the SEEA basic methodology at the federal level.5 The study was conducted in accordance with the provisions of international methodological documents on accounting for the value of natural assets in national wealth.6 More than ten years of experience in monetary assessment of natural resources in accordance with the SNA/SEEA approaches enabled us to conduct in Russian regions the analysis of conceptual approaches to recording natural resources in the SNA as a part of financial assets and establishing a satellite system of environmental-economic accounting. The state statistical monitoring system in use of natural resources and environmental protection was analyzed in terms of compliance with the SNA principles, and the methodology for valuating natural resources was summarized in accordance with the SNA/SEEA requirements.
These studies allowed development of methodological principles of recording the monetary estimate of natural wealth in the statistical system. With the support of Rosstat (Federal State Statistics Service), the SEEA matrices were completed, for the first time, by constituent entities of the Russian Federation. In our opinion, for Russia, such disaggregation is crucial because timely identification of dangerous trends of natural capital depletion, in both monetary and physical terms, is especially important for regions. The results obtained visibly intensified activities of accounting for natural assets in national wealth within the framework of the Federal Target Program “Development of the State Statistics in 2007-2011.”7 This program envisaged improvement of statistical monitoring of the use and replenishment of natural resources and environmental protection based on the effective system of indicators and methodology of their establishment.
Stage Four: assessment of the country’s natural capital based on the industrial approach (2012 until present). The development of works in the Russian Federation was based on the following documents:
1) System of National Accounts, 2008, Central Framework of the System of Environmental-Economic Accounting, 2012, System of Environmental-Economic Accounting for Water, 2012;
2) Roadmap for Accession of the Russian Federation to the OECD Convention adopted at the 1163rd session of the OECD Council of November 30, 2007;
3) Decree of the Government of the Russian Federation (October 12, 2012 No.1911-r) on Making Amendments to the Federal Plan of Statistical Works Approved by the Government of the Russian Federation (May 6, 2008 No.671-р);
4) Action Plan to Perform Works Envisaged by the Decree of the Government of the Russian Federation (October 12, 2012 No.1911-r), in respect of the monetary estimates of natural resources and calculation of resource efficiency (Order of Rosstat of July 8, 2013 No.274).
Under the guidance of Rosstat, methodological recommendations were prepared on economic assessment of water, mineral resources, ground and water bio resources in the SNA. In this area, in 2014-2015, the Cadaster Institute developed “Methodological Recommendations for Economic Assessment of Forest and Hunting Resources (as Non-Cultivated Biological Resources),” covering the following:
1) key concepts of forest and hunting resources as non-cultivated biological resources in terms of their assessment as a part of natural capital in accordance with the SNA/SEEA principles;
2) the SNA/SEEA methodological approaches in relation to the general principles and peculiarities of assessment of these resources at the current market value in the institutional conditions and statistical reality of the Russian Federation;
3) procedure for conducting calculations in assessment of forest (timber and non-timber forest products) and hunting resources and calculation of the resource rent and discounted value of non-cultivated biological resources (Fomenko, G., Fomenko, M., Loshadkin & Arabova, 2016).
The work conducted is particularly topical due to the introduction of a range of statistical indicators of stocks of non-cultivated biological resources (timber and animals, in physical terms and current market prices as of the beginning and the end of the year), changes in non-cultivated biological resources starting from 2016 and indicators of the use of non-cultivated biological resources in the economy, in physical terms and current market prices, starting from 2019.8
Our work on this book was designed to demonstrate our vision of ways and specific features of development of information systems in natural resource use and environmental protection using SEEA. For this purpose, we deemed necessary to provide the philosophical and methodological framework for establishing and developing the SEEA based on the theory of living self-organized systems; to show the essence of the SEEA, including its origins and development, its place and role compared to other information systems, its institutional and organizational peculiarities; to describe the experience of implementing the SEEA provisions in Russia; to demonstrate, on the example of a number of projects, the effect of the results of assessment of environmental resources and ecosystem service on addressing complex issues of natural resource management and strategic planning of territorial development; to describe the SEEA development paths. Our aim was to take into account the new requirements for SNA/SEEA development to the maximum extent possible, to present some of our conclusions and observations, to make the material useful for a wide circle of experts and practical specialists.
METHODOLOGICAL PREMISES. SIGNIFICANCE AND BASIC PROVISIONS OF SNA/SEEA
In today’s dynamic world the concept of sustainability increasingly implies, not so much stability, as the ability of systems to survive, adapt and develop under the impact of unpredictable changes or even catastrophic events. In order to achieve sustainable development, i.e., to attain well-being within the limits of the planet’s environmental potential, there has to be a radical change in existing patterns of production and consumption, which are the root cause of hazardous impact on the environment and climate. Such changes depend upon profound transformation of principal public institutions, practical approaches, technologies, politics, lifestyle and thinking.
The attainment of a new level of stability requires green innovation, quality forecasting and new effective partnership between corporations, governments, territorial communities and other stakeholders. Sustainable control by government over environmental, social and economic development depends on obtaining and analyzing relevant scientifically based and officially substantiated information timely. The required information includes, in addition to environmental indicators, data on the stocks of various kinds of natural resources, which are essential components of the environmental capital of a region or country, on the manner and intensity of their use in the economy, the yields obtained, etc.
The declaration of global goals of sustainable development in 2015 will entail change in approaches to strategic environmental planning and management by objectives at every level of territorial organization. Methodologically, this means expansion of scope and shift of focus at all stages of information handling, starting from the choice of required data, their generalization, analysis and interpretation, entailing the need for a new approach to the provision of information and analysis. In turn, that provision depends on a goal-oriented synthesis of the indicators of sustainable development and the green economy, of environmental indicators and specific socio-cultural measurements. The key element of the new information synthesis is a definition and substantiation of the core platform, which is adequate to the needs of today.
Measurement has paramount importance in the theory of sustainable development. As early as the 15th century Nicholas of Cusa, who was a forerunner of the scientific perception of the world, believed that humans can cognize nature by means of their senses, imagination, reason and intellect. “Reason, from the moment that its nature admits speculation, perceives only the universal, the incorruptible and the unceasing.” In his treatise The Layman on Wisdom and the Mind he states the need to develop precise methods of measurement, particularly mathematical measurement (Nicholas of Cusa, 1979). Nicholas of Cusa believed correctly that the cognition of genuine essences is not possible, or can only be attained by more or less accurate conceptions. He advocated the concept of learned ignorance: even the deepest knowledge does not eliminate ignorance.
Changing the World View The following points are important for an understanding of the nature of the changes now affecting information support for resource use and environmental protection.
First of all, at the start of the third millennium the world community is increasingly conscious of the global character of environmental problems and the real possibility of the occurrence of environmental crises (not just regional but also global), and also understands the responsibility of humankind for any such developments.
Secondly, recognition of the threat of environmental catastrophe and the impossibility of preventing it by means of technology or economic mechanisms alone has led to a reconsideration of many conceptions, including those concerning the relationship between Society and Nature. Many outstanding thinkers and philosophers of the 20th century (Teilhard de Chardin, Vernadsky, Fromm, Jaspers, etc.) insisted that the development of society could not progress further without changes in the existing paradigm of the relationship between human and nature. It is no coincidence that the late 20th century saw the philosophy of environmental crisis develop into a separate branch of philosophical study. According to Hösle, “... the philosophy of environmental crisis must determine the place of this (environmental – Auth.) threat within the philosophy of the history of human culture.”
Schelling’s subject-object approach, which introduces a perception of the essence of nature in its entirety and not just as a collection of natural objects and resources, is of particular importance for proper understanding of today’s world. We would note that nature as “wholeness” has been substantially reconsidered in phenomenological philosophy and the sociology of resource use. Precisely the phenomenological view of nature, a new understanding of the basic difference between nature as a constituent element of the “world as experience” and as a store of resources had made it possible to methodologically substantiate the importance of evaluating natural resources and ecosystem services in their broadest sense.
This perception of the world has been developed by the new systemic concept of life (Bogdanov, von Bertalanfi, Prigozhin, Maturana and Varela, Capra, Kuznetsov, Moiseev, etc.) The new paradigm is often called holistic, which emphasizes its view of the world as an integrated whole. It focuses on the complexity of “systems” views and introduces new key concepts, such as self-organization, social communication networks, development as a systemic process.
In this concept the essential properties of an organism or a living system are properties related to the whole which are not inherent in any of its parts. There has been a change in the conception of the relationship between parts and whole. In the systems approach, the properties of the parts can only be deduced from the organization of the whole. Accordingly, the systemic approach focuses on main principles of organization rather than on “building blocks.” Capra noted that Systems Thinking is contextual thinking; and since to explain things in terms of their contexts is to explain them in terms of their environment, all systems thinking is a philosophy of the environment. Shifting focus from the parts to the whole can be seen as a transition from objects to relationships. According to the mechanistic world view, the world is a collection of objects. They inevitably interact with each other, hence there are relationships between them. However, the relationships here are secondary, as shown schematically in diagram A (Fig. 1.1). Systems thinking proceeds from the idea that objects themselves are networks of relationships included in bigger networks. For the systems thinker, relationships are primary. The boundaries of various patterns (“objects”) are secondary, as shown in diagram B (Fig. 1.1)
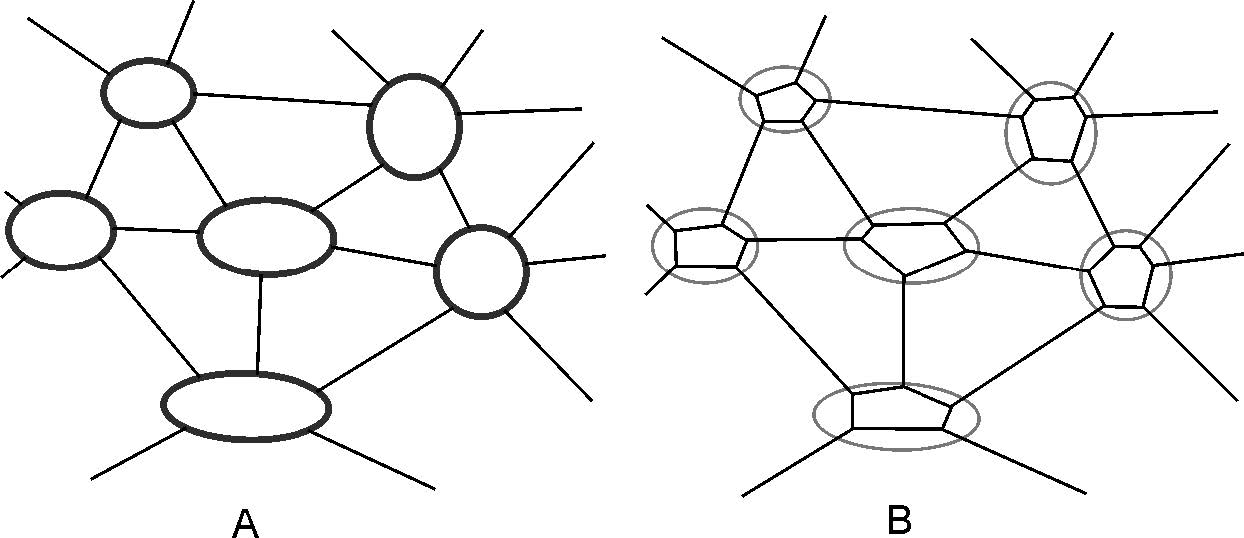
By presenting the living world as a network of relationships, network thinking (more elegantly, in German, vernetztes Denken) has become another key aspect of systems thinking (Capra, 2004). Such a philosophical and methodological position does not permit the human being to be thought of as a creature who has accidentally “fallen out” of the natural world that surrounds him or even become its natural adversary.
The adoption of the global goals of sustainable development9 assumes the description of future events as “must do,” setting radically new methodological problems for environmental work (in a broad sense)10 , based on the goal-oriented synthesis of natural, humanitarian and technical expertise. This enhances the role of environmental ethics which, according to Jonas, must gradually become “future-oriented ethics” (Zukunftethik): the current situation requires “far-sighted forecasts, broad responsibility (for the future of humankind) and large-scale vison (the whole future essence of human) as well as ... harnessing the power of technology to the greatest possible extent” (Jonas, 2004).
Here, the ethics of preserving life acquire an ontological sense, as described by Kant, Fichte, Hegel and, in particular, Schelling, and renounce the strict opposition of subject and object11 . On the one hand, the human being is produced by nature and thus is an integral part of nature. On the other hand, the human is the only living being capable of cognizing the principles of its own existence and evolution as well as those of nature. This duality, according to Schelling, is the enigma that any theory of the human-nature relationship has to address. Schelling was described by Bulgakov (2009) as a “philosopher of nature and objective reality.” Two profound and vital ideas put forward by Schelling are of the utmost importance today for the theory of sustainability:
1) identity of subject and the object in their dynamic development;
2) understanding of nature as a living, evolving organism, corresponding to the concept of “Gaia,” when the Earth was treated as a living being.
E. Laszlo (1997) was therefore correct in stating that the environmental ethics of anyone who strives to enhance biosphere potential for supporting human life are inevitably anthropocentric. A human being should not, however, be unreasonably anthropocentric, because people as a biological species are endowed with the natural capability (and hence the natural right) to strive for collective survival. Individual and social behavior must be oriented to complying with the paramount requirement: to maintain favorable conditions in the biosphere by enhancing people’s responsibility for their actions that affect the natural world. Recognition that nature itself has rights means that people must eliminate intended and unintended negative consequences of their actions for the natural world and be liable for their actions.
Schelling’s subject-object natural philosophy, which endows the natural world with its own dignity irrespective of the human self-development process, is of great significance for sustainable development today. In this perspective the natural world appears as something meaningful, combining the true, the good and the beautiful, worthy of honor and love from human beings as an image of the absolute rather than as something, which they have constructed. Methodological engagement with the interaction of ethics and economics in respect of environmental work is furthered by the ethical economics developed by Kozlovsky. His work offers a deeper insight into the role of ethical codes and religions as guarantors of an ethical approach to nature. Also of importance for understanding the humanistic essence of sustainable development are the views of Bulgakov, while works by Jonas and Hesle are of great significance for the philosophy of environmental crisis, particularly for substantiating the imperative of “responsible behavior.”
Admitting a Multivariate Future. Any human practice, and particularly that relating to the environment, focuses on a transition from the past to the future that appears reasonable to decision-makers. Possible alternative futures are determined by the synthesis of socio-cultural traditions and trends and tendencies spurred by modernization processes. One of the shrewdest typologies of future scenarios was suggested by Lutz in 1988 (Table 1.1).
Table 1.1 Brief characteristics of main future scenarios
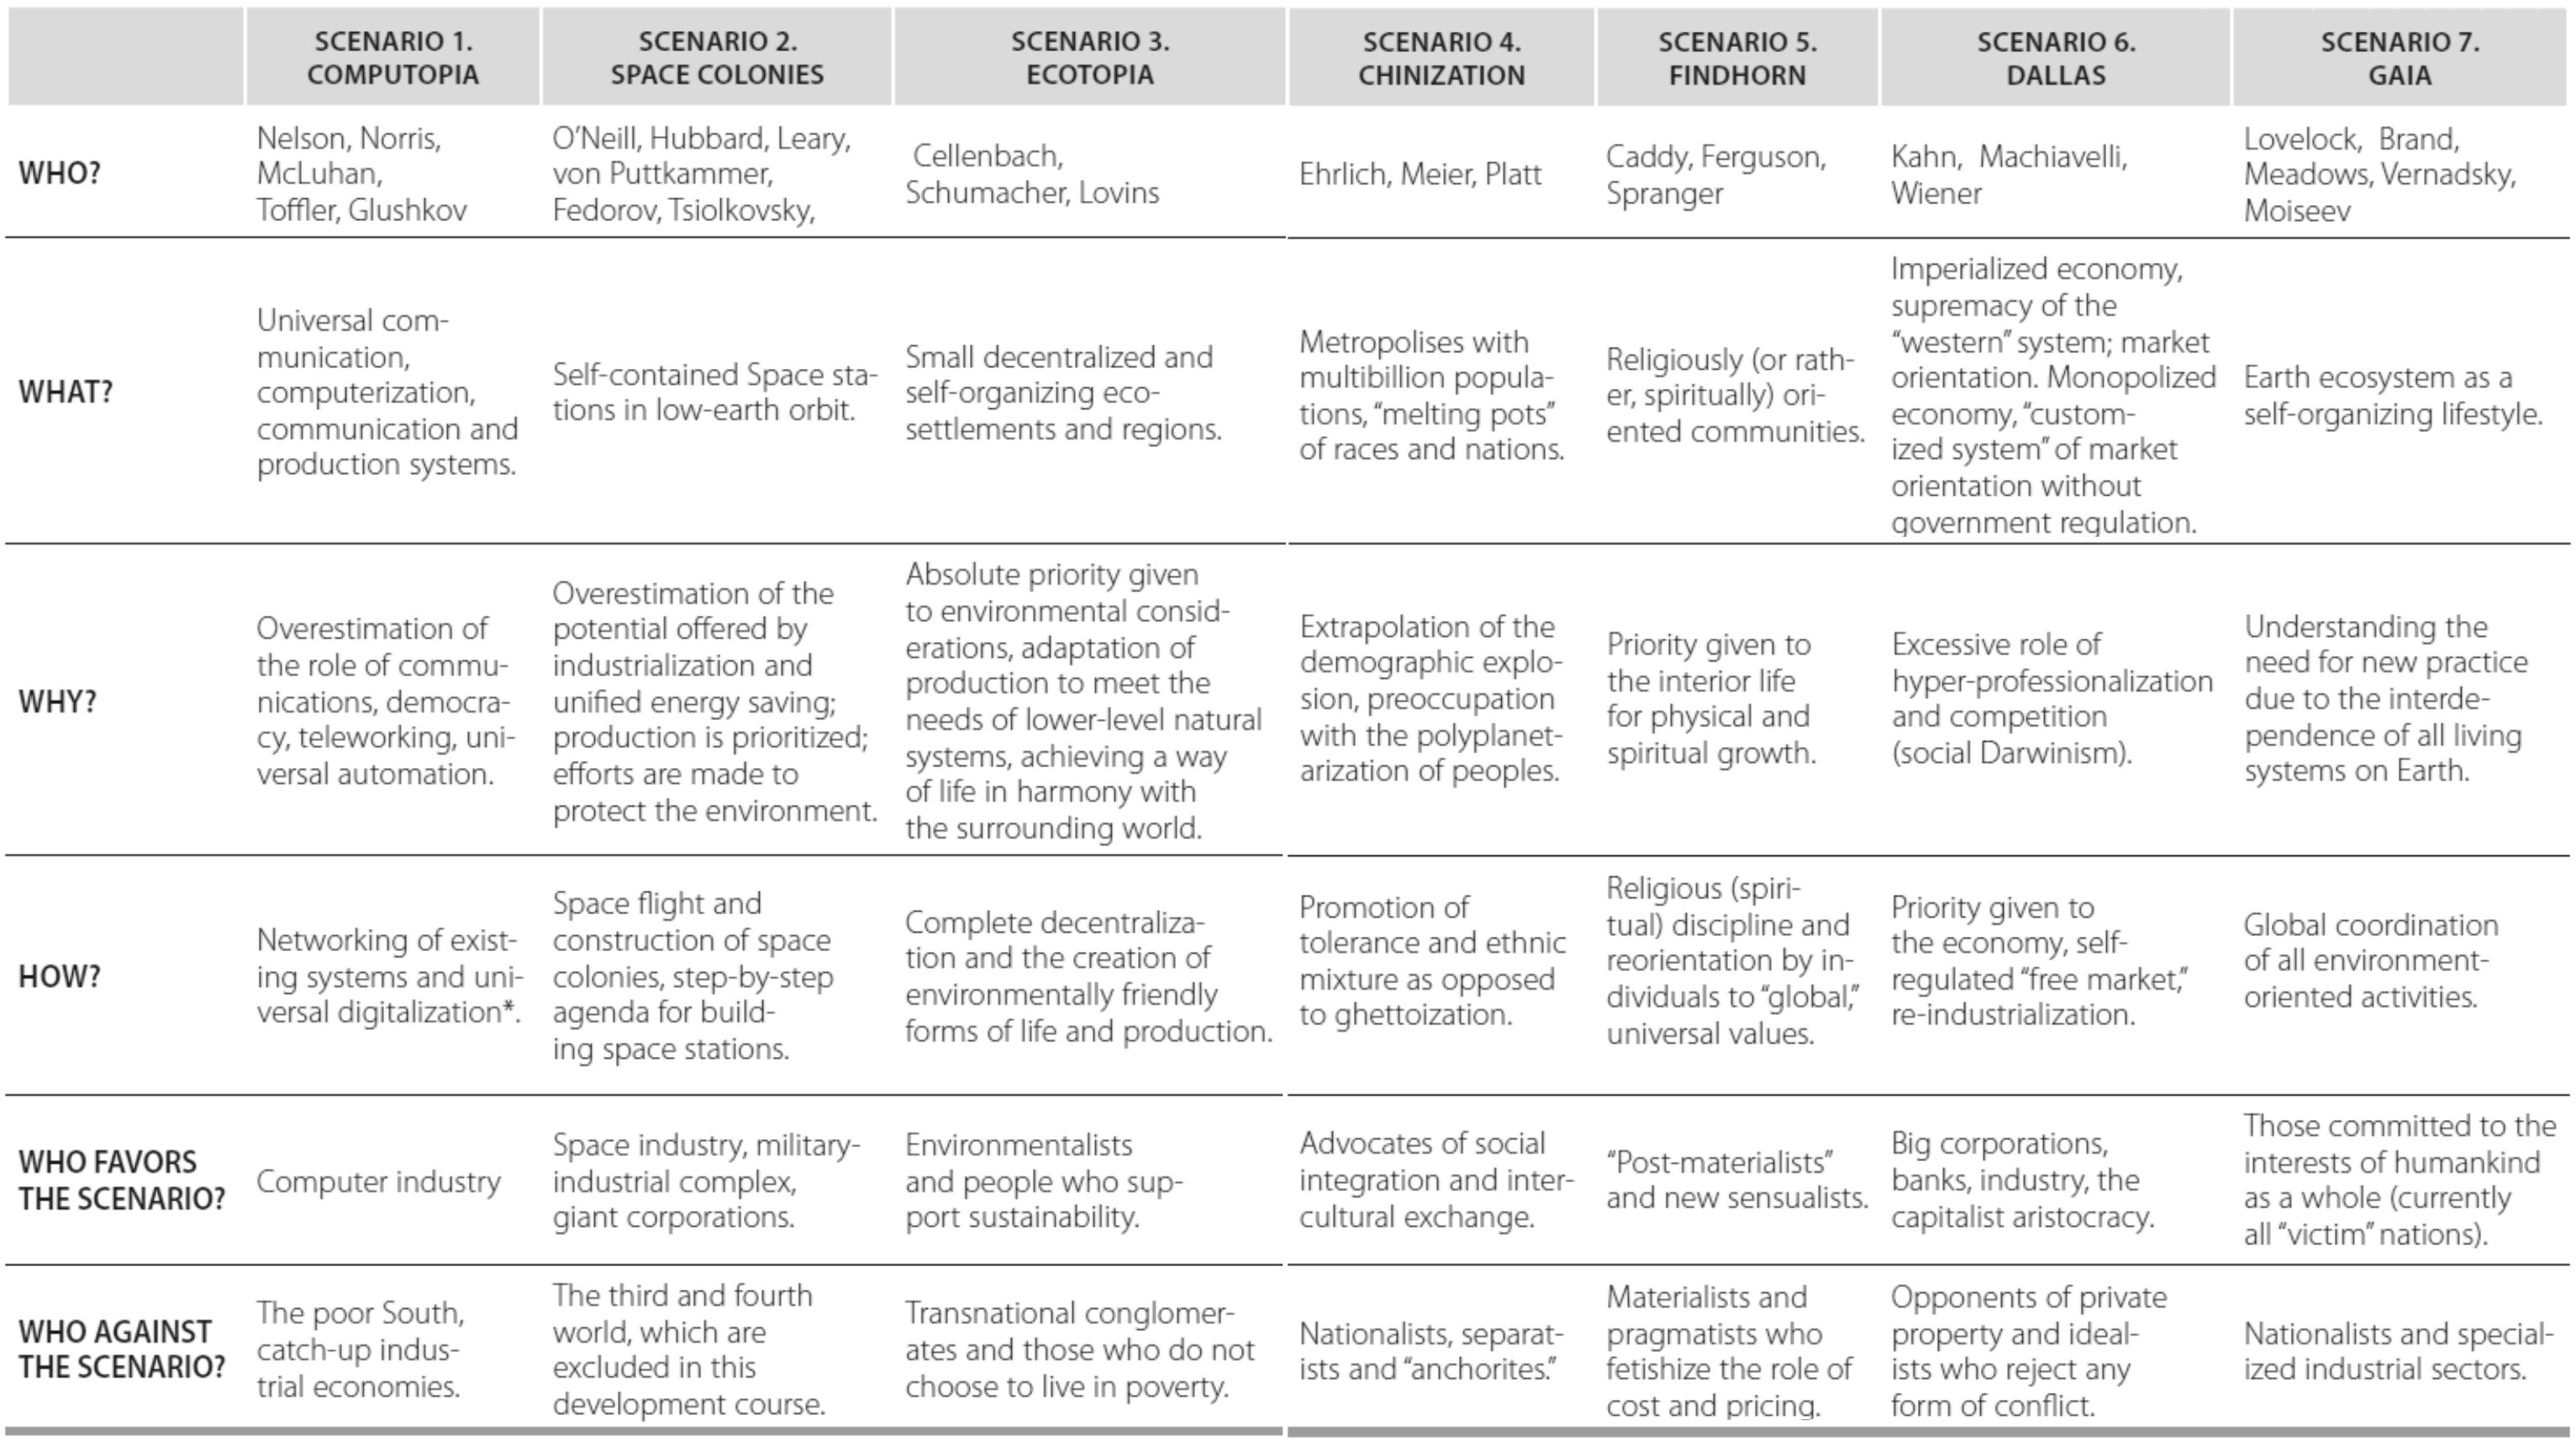
* Digitalization means the conversion of information into discrete forms and its subsequent use to generate numerical indicators
Even looking at the main conceptual trends very generally, substantial differences between their proponents and opponents are evident as regards priority goals, approaches and methods. There is clearly a broad variety of views on environmental priorities, the efficiency of environmental institutions, information support, etc.
It is impossible to predict which scenario will be realized since too many factors are at play and some of them are a matter of chance. It is only possible to identify the causes that have led to the realization of a certain scenario and to discover its logic in retrospect. All that one can do when making forecasts is to list a range of possibilities, identify more and less probable options and determine which of the probable scenarios are particularly hazardous for specific countries and nations, and for mankind as a whole.
The fundamental right of people to choose their own future must be acknowledged unless their choice is evidently destructive for mankind as a whole. For this reason all contemporary definitions of sustainable development, starting from the definition given by Bruntlann12 , proceed by stating what has to be done in order to avoid the most undesirable future scenarios. In other words, a range of acceptable solutions for a country or nation is determined by applying global indicators for human impact on the environment.
Responsible behavior capable of preserving the life of present and future generations must focus on preventing global environmental catastrophe, mitigating risks and preventing conflicts in the sphere of environmental management at minimum cost. Devising and implementing approaches to sustainable development depends on finding ways forward and limitations in the regulation of social, natural and systems, and means of purposeful impact on these systems in response to growing development risks in a production-oriented society.
Since spatiality is one of the fundamental dimensions of human existence, structuring our world outlook and action, it makes sense to speak of a space of risks, including environmental risks, at all levels of territorial organization (both explicit and implicit). This is, essentially, a geographical space treated in terms of riskology and distinguished by territorial characteristics, generating an aggregate of relationships between geographical objects in a specific territory evolving over time (Environmental Institutions, 2010). In this approach the measurement of environmental risks and respective indicators must be included in any evaluation of the territory’s natural capital.
Changing the concept of “sustainable resource use.” Contemporary philosophy tends to affirm multiple forms of rationality. According to the concept of the unity of rationalities, scientific, philosophical, religious and other rationalities are not alternatives but aspects of a single and multifaceted mind. It is therefore wrong to be skeptical about other forms of rationality that are characteristic of other civilizations and nations, or of other historical periods. In particular, the idea of transformation of the natural world and its harnessing to human needs has prevailed in western culture in all periods of its history up to the present. However, the same idea is virtually absent in traditional cultures where the relationship of people to the world around them has been understood and evaluated from completely different positions: an inherent conservatism, slow rates of evolution of human action, and the predominance of traditional means of environmental regulation have constrained the transforming power of human beings.
The most acute value-based conflicts arise from differences in the understanding of “rational behavior” as regards environmental management and nature conservation. In our view, in order to ensure sustainability and prevent conflicts escalating to a critical level, emphasis has to be placed on people’s responsibility for their own future and the future of mankind as a whole. Jonas maintains that the concept of homo sapiens (“reasonable human being”) should be substituted by that of homo responsabilis (“responsible human being”), and traditional ethical systems should be substituted by a new ethics – the ethics of responsibility. The imperative addressed to the new types of actors must, according to Jonas, be “Act so that the effects of your action are compatible with the permanence of human life” (Kane & Osantowski, 1981). This idea is in tune with the views of Ladd who suggested that responsibility should be considered the essential feature of a human being: “People are beings who understand their actions and who are responsible for the consequences of their actions” (Ladd, 1975). A person who bears responsibility for achieving the sustainable development goals of mankind13 , or of his or her country and local community needs adequate information about the state of the Society-Nature system and real development trends.
Main implications for the SEEA arising from the systems concept of life, recognition of a multivariate future and multiplicity of rationalities. Changes happening in the world today point to a number of new ways, in which information can be usefully employed to support sustainable resource use and protection of the environment.
-
Work to reform the information and statistical systems, which describe relationships in the complex non-linear Society-Nature system, must bear in mind that, in the systems approach, we must measure relationships rather than objects, and particularly relations between ecology and the economy at all levels of territorial organization. The SEEA can be described as an organizationally closed network, which is open to flows of energy and resources. It has a networked structure where the SEEAs of all levels of territorial organization (from global to local) are interconnected. According to Bateson14 , each individual SEEA can be regarded as a “metapattern,” which is a system-forming and structuring core for informational and territorial systems of resource use and environmental protection.
As a networked structure, the global SEEA (though as yet insufficiently structured) is gradually being assembled from similar but at the same time different (depending on broadly conceived geographical conditions) SEEAs from various levels of territorial organization (country, region, local territory). If the SEEA is viewed in terms of and through the tools of fractal geometry15 , one notices an amazing feature: in the development of environmental-economic accounting specific patterns are repeated over and again at descending levels, such that their parts at each level appear to be a whole.
The fundamental significance of an integrated approach, which is implied by the systems concept of Life, tends to elude the attention of researchers. This is seen, e.g., in the attempt to develop primarily industrial rather than territorial SEEAs. The former, despite their obvious topicality, fail to address the integrated development of territories and do not make it possible to select the best options for resource use (judged by environmental and economic criteria).
Without an integrated territorial approach to the development of SEEAs, one cannot integrate them in the measurement of ecosystem service flows, the very concept of which, introduced in the report Ecosystem Evaluation on the Threshold of the Millennium (Millennium Ecosystem Assessment, 2005), substantially changed the tenor of ecological discussions, including discussions of biodiversity conservation. The evaluation of ecosystem services paves the way for implementation of a number of conceptual provisions that are critical for including the high economic value of specially protected areas (SPAs) in the natural capital of territories, so that the respective indicators can be accounted in the SEEA (Cadaster Institute, 2006b; 2011; 2012b; 2014; 2015a).
The understanding of the SEEA as a system-forming territorial core, a metapattern of information systems in the sphere of resource use and environmental protection, makes it methodologically untenable to assert that raising the quality of all indicators is a prior condition for the SEEA to be successful in any country. In reality, an attempt to raise the quality of indicators across the board leads to a lengthy and costly process of national statistics reform, postponing their systematic analysis. In our view, such an (essentially Cartesian) approach is at variance with the logic of the systems concept of Life and thus with the theory of sustainable development. So every country or region should, at the initial stage of work on an SEEA, systemically evaluate information sources as to the completeness, validity and accessibility of indicators. As practical experience has shown, the restricted character of traditional statistical systems16 makes it necessary to expand the range of data, which are handled, beyond official statistics, making use of administrative and expert data as well.17 It is particularly important to determine the trustworthiness of individual indicators and the system as a whole, identifying data gaps and finding ways to improve their quality (pilot field studies, calculations, adjustment of the available data, etc.) The process should begin with the preparation of basic territorial accounts (matrixes, which are the foundation of the SEEA), even if some indicators have to be accepted as expert assessments, and even if it is not possible to make a representative cost estimate. Completion of SEEA matrixes in physical terms provides useful information for comprehensive resource use and environmental management.
Our experience in multiple studies regarding the application of SEEA methodology at different government levels (federal, regional, municipal and micro-level) showed that the new systemic approach to obtaining and using indicators of natural capital and its components (even if the indicators were no more than expert assessments in some cases) broadens the potential for analyzing data on environmental resources and ecosystem services as a part of national, regional and even local wealth, and as an important factor for the sustainable development of territories. SEEA methodology can provide comprehensive information for appraising efficiency in the management of natural capital and efficiency of budgeting as applied to environmental management. It also becomes possible to analyze dynamics of the environmental resource stock in a specific territory and measure to what extent the environmental capacity of the territory can meet the resource needs of its economy.
-
Having acknowledged the multiplicity of possible futures, we need to identify and assess the different scenarios and trends based on criteria of sustainable development and determine which of them represent a hazard for human beings and ecosystems. Acceptance of the need and expediency of certain restrictions in order to avoid negative trends entails special importance of indicators that measure environmental impact and green growth (describing processes between the environment and the economy). Therefore, when estimating the amount and structure of natural capital for purposes of the SEEA, indicators are needed, which identify the risk of dangerous depletion, in both its environmental and social aspects. This highlights dangers timely and helps to find ways of meeting budget and public income shortfalls, thereby preventing conflicts in environmental management before they can become critical. Depletion of intensively exploited natural resources (mainly non-cultivated resources, such as fish and game, forest resources or mineral and energy resources, as well as water resources) can lead to substantial loss of household incomes, exacerbating environmental problems and conflicts. Resolving this problem is of crucial importance for sustainable development and it is specifically mentioned in the WTO regulations, which do not preclude measures for “the prevention of natural resource depletion.” It should, however, be possible to avoid such measures from becoming a “covert limitation on international trade” or a “discriminatory” measure; they must be applied alongside limitations on domestic production or consumption (art.XX(g) WTO/GATT Agreement)
-
Change in the concept of “sustainable resource use” by accepting its multifaceted character and, at the same time, the unity of forms of rationality expands our understanding of environmental-economic interrelationships as relations within an open, non-equilibrium system. Accepting the unity of rationalities makes it absolutely inappropriate to be skeptical about other forms of rationality (inherent to other civilizations and nations, or other historical periods), provided that such forms of rationality do not destroy the system of Life on Earth.
Adoption of the Sustainable Development Goals by the UN General Assembly 2015 should intensify the convergence of rationalities as regards environment management based on sustainability. This means that new system links are being formed, oriented to preserving Life on the Earth, which motivate and define how information systems can be created for sustainable resource use and environmental protection.
For many modern communities a change of tack towards sustainable development entails a shift in perception and transfer to systems thinking: from parts to the whole, from objects to relationships, from content to patterns. This evidently applies to the SEEA, which is an important element of sustainable development. At the same time, the importance of educating people about sustainable development becomes paramount, since implementation of the SDGs requires system changes in society, and that can only be achieved by nurturing a sense of responsibility 18 among people and in communities.
-
When measuring relationships in the Society – Nature system, the SEEA proceeds from the multiplicity of interconnections within communities. To respect the sustainability of communities is to respect these relationships. According to Capra (2003), reintegration into the life web depends on the establishment and maintenance of sustainable communities, in which we can satisfy our needs and wants without detriment for future generations.
Clearly, the establishment and maintenance of sustainable communities requires changes to information systems and indicators. Today, an SEEA is what makes it possible to measure various processes in territorial environmental-economic system and to measure socio-cultural specifics of different nations, which restrict and regulate useful institutional changes. This can be done with the help of the SEEA, using ethnometrics and humanization of monetary estimates of environmental resources (Fomenko G., 2014; 2017). The flexibility of the SEEA enables new Society-Nature measurements to be included into the systems analysis. We believe that alignment of the SEEA with socio-cultural measurements should be a research priority.
The SEEA methodology for preparing accounts permits extension of physical reporting on the use of natural resources to the sphere of the non-observable economy (by generating so-called “shadow” accounts), while the methodology of economic valuation (based on the theory of full economic value) enables researchers to discover subjective assessments of specific environmental resources and behavioral aspects of resource use. The latter expands the scope of economic evaluation in accordance with the actual value of natural resources for users, taking account of socio-cultural, non-economic values and thus providing important information for making effective managerial decisions.
-
It is important, when developing an SEEA, to realize that the main conflict between the industrial economy and ecology stems from the fact that nature is cyclical while industrial systems are linear. According to the systems theory of Life, sustainable patterns of production and consumption must acquire a cyclical character, similar to that of natural processes (Capra & Luisi, 2014). The European Environment – State and Outlook 2015 report discusses the problems of environmentally unbalanced systems of production and consumption and their long-term and often complex impact on the environment and on people’s health. The authors stress that society obtains many benefits but inflicts damage on the environment due to our linear economy based on the principle “buy – use – dispose,” our huge reliance on many natural resources, an “environmental footprint” that exceeds the planet’s capabilities, unfavorable impact on the environment of poorer countries and unequal distribution of the social and ecological benefits provided by globalization. It is clear that any long-term solution must be based on the transformation of major systems: transport, energy, utilities and food.
It has become clear that the achievement of sustainability depends almost completely on the creation of an economy of a special type, where growth of human well-being is combined with reduction of risks for the environment. Such an economy is called a “green” economy. The most common definition is the one given by UNEP: “the green economy is one that results in improved human well-being and social equity, while significantly reducing environmental risks and ecological scarcities.” The concept of effective resource use is directly associated with this.
The SEEA has to be developed in a way that makes it responsive to the processes involved in transition to the green economy. Firstly, there has to be support for various structures and functions of ecosystems (ecosystem sustainability) and ways must be found of reducing the use of resources in production and consumption and of mitigating their impact on the environment (resource efficiency) (Fomenko G., 2011).
-
According to the systems theory, ecosystems and human communities are always at risk of destruction, should their fluctuations exceed the tolerable limits, so that the systems are unable to compensate. If, e.g., someone tries to maximize any individual or group variable, this will inevitably result in destruction of the system as a whole. Therefore, timely identification and warning of a dangerous state of the Society – Nature system is increasingly understood to be the crucial condition for the efficiency of information systems, including statistical systems.
Particular dangers arise if a bifurcation point19 is passed, which is a critical state of the system, so that the system becomes unstable in its fluctuations and uncertainty arises whether the state of the system will turn chaotic or whether it will ascend to a new, more differentiated and elevated level of regularity. Attention should be paid to the position of many leading experts whose opinion was voiced most coherently by Rotmans at the Green Growth and Sustainable Development Forum 2015 (Enabling the next industrial revolution: Systems innovation for green growth, OECD). In his report “Transition to a Low Carbon Economy: How to Accelerate the Transition?” Rotmans states that the transition to a new economy has today reached a critical point (Fig. 1.2) involving chaos, conflicts and the spread of hostilities in various regions20
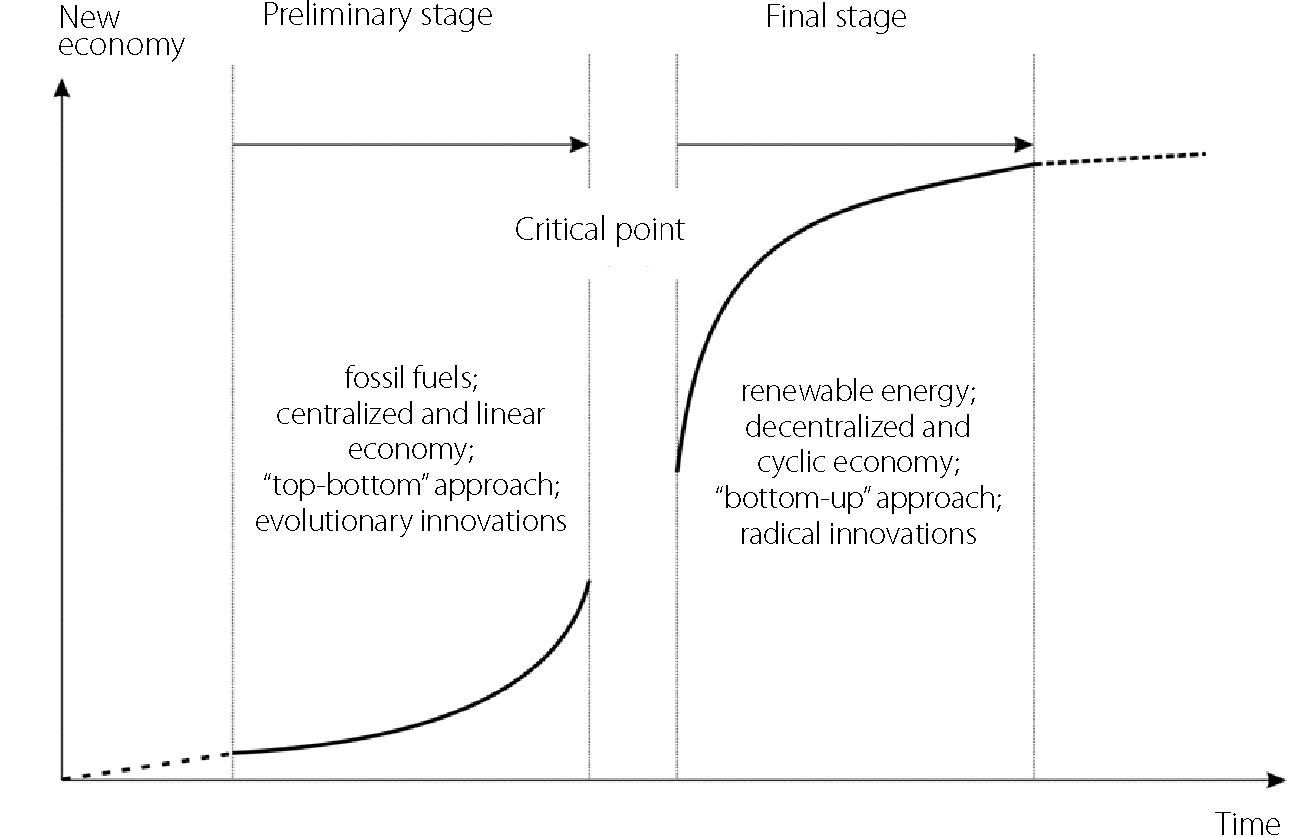
Fig. 1.2 Features and Dynamics of Transition to New Economy
The bifurcation point cannot be successfully passed unless the system has sufficient flexibility. According to the systems Life theory, all observable ecosystem variables (population density, access to nutrients, weather patterns, etc.) always fluctuate, as do the conditions of society and production. The Life web is a flexible fluctuating network. The more variables are involved in fluctuations, the more dynamic and flexible the system is and the greater its ability to adapt to changing external conditions. Low flexibility of a system is manifested by stress; notably, stress arises when one or more variables characterizing development sustainability approach their extreme values, heightening the level of rigidity and stress throughout the system. According to Capra (2004), prolonged stress is harmful and destructive for the system, while temporary stress is an indispensable feature of life. Environmental fluctuations in the stable state do not go beyond permissible limits even though disturbances in the Society – Nature system occur all the time and the network responds to them by recurrent fluctuations. In the stable state measurement of processes occurring between the economy and nature is effective and helps to reveal trends by the application of linear prediction methods.
When the world is passing through a bifurcation point related to technology transition to a new economy, we observe a crisis in measurability: the existing statistics and industrial information systems, which have been used to measure development trends in the departing era, miss the new growth trends and fail to identify threats to sustainable development. This makes new demands on the SEEA methodology and its implementation, particularly for greater sensitivity to new growth features. Important criteria of SEEA efficiency are:
1) flexibility, i.e., ability to “see” emerging new development trends in the Society – Nature system and to measure them;
2) ability to obtain necessary and sufficient information to control environmental and economic safety criteria, non-observance of which leads to destruction of the system, and to search for optimal values of the system’s variables.
The System of National Accounts is an internationally coordinated standard set of recommendations to measure indicators of economic activities in accordance with strict rules of accounting and reporting at the macro level. The system is based on the principles of economic theory and in its general form is a detailed report on economic activities in a country and on the relationships between various economic actors and groups of actors in markets or outside markets. Those recommendations are worded as a system of concepts, classifications and rules of accounting, which make up an internationally coordinated standard for calculating gross domestic product (the most commonly used indicator of economic performance). The SNA methodology calculates and presents economic indicators in a format that is specially designed for the purposes of economic analysis, decision-making and the preparation of economic policies. The accounts contain a large amount of detailed information organized according to the principles of economic theory and approaches to functioning of the economy (SNA, 2012, chapter 1, paragraph 1.1).
The conceptual basis of the SNA consists of accounts that are:
- inclusive of all kinds of activities and their consequences for all economic actors;
- mutually coordinated, since they use identical values and the same rules of accounting in order to establish the impact of one action on all parties involved in the economic process;
- integrated, because all consequences of the action of one subject are necessarily reflected in the resulting accounts, including balance sheets which show the influence of the actions of subjects on wealth measurement (SNA, 2012, chapter 1, paragraph 1.1).
In this way, the SNA fulfills an important informative and analytical function, structuring blocks of statistical information and answering the generalized questions: what happened in the economy? what actors participated and for what purposes? The SNA focuses on the measurement of production of goods and services (SNA, 2012, chapter 1, paragraph 1.6) and this predetermined its basic conceptual elements: institutional units and sectors; transactions and other flows; assets and liabilities (or stocks); products and units that produce them; goals.
Assets and liabilities are components of the balance sheet for the economy as a whole and for institutional sectors. The balance sheet shows stocks of assets and liabilities owned at a certain time by an individual unit or sector or by the economy as a whole. Balance sheets are usually prepared at the beginning and end of the reporting period although they can be prepared at any time. Stocks arise from accumulation of the outputs of previous transactions and other flows and they are also affected by subsequent transactions and other flows. So stocks and flows are closely interrelated (SNA, 2012, Chapter 2, paragraph 2.33).
Generally, an asset is an accumulated stock of value providing the owner with economic benefits or a number of economic benefits that arise from its ownership or use during a certain period. It is a means for the transfer of value from one reporting period to another. All assets in the SNA are economic. (SNA, 2012, chapter 10, paragraph 10.8). The relevant assets are those in some form of ownership and whose economic benefits are obtained by their owners through owning them or using them in economic activities as stipulated in the SNA. Accordingly, durable consumer goods, human capital and environmental resources, which cannot provide economic benefits to their owners, are not included in the scope of assets in the SNA.
Classification of assets at the first level distinguishes non-financial and financial assets (Fig. 1.3). Non-financial assets are mainly represented by items, which can be used in economic activity and which are simultaneously stocks of value. Financial assets are mainly stocks of value.
There are two categories of non-financial assets:
- products created by production processes within the sphere of production defined in the SNA;
- non-financial assets, which have come into being by other means than production processes. Non-produced assets consist of three categories: environmental resources; contracts, lease agreements and licenses; and acquired goodwill and marketing assets (SNA, 2012, Chapter 10, paragraph 10.14). Environmental assets are resources of natural origin, such as land, water resources, forests and mineral resources, which have economic value (SNA, 2012, Chapter 10, paragraph 10.15).
Detailed examination of the methodological premises of the SNA 2008 on environmental resources shows that not all of them can be classified as economic resources.
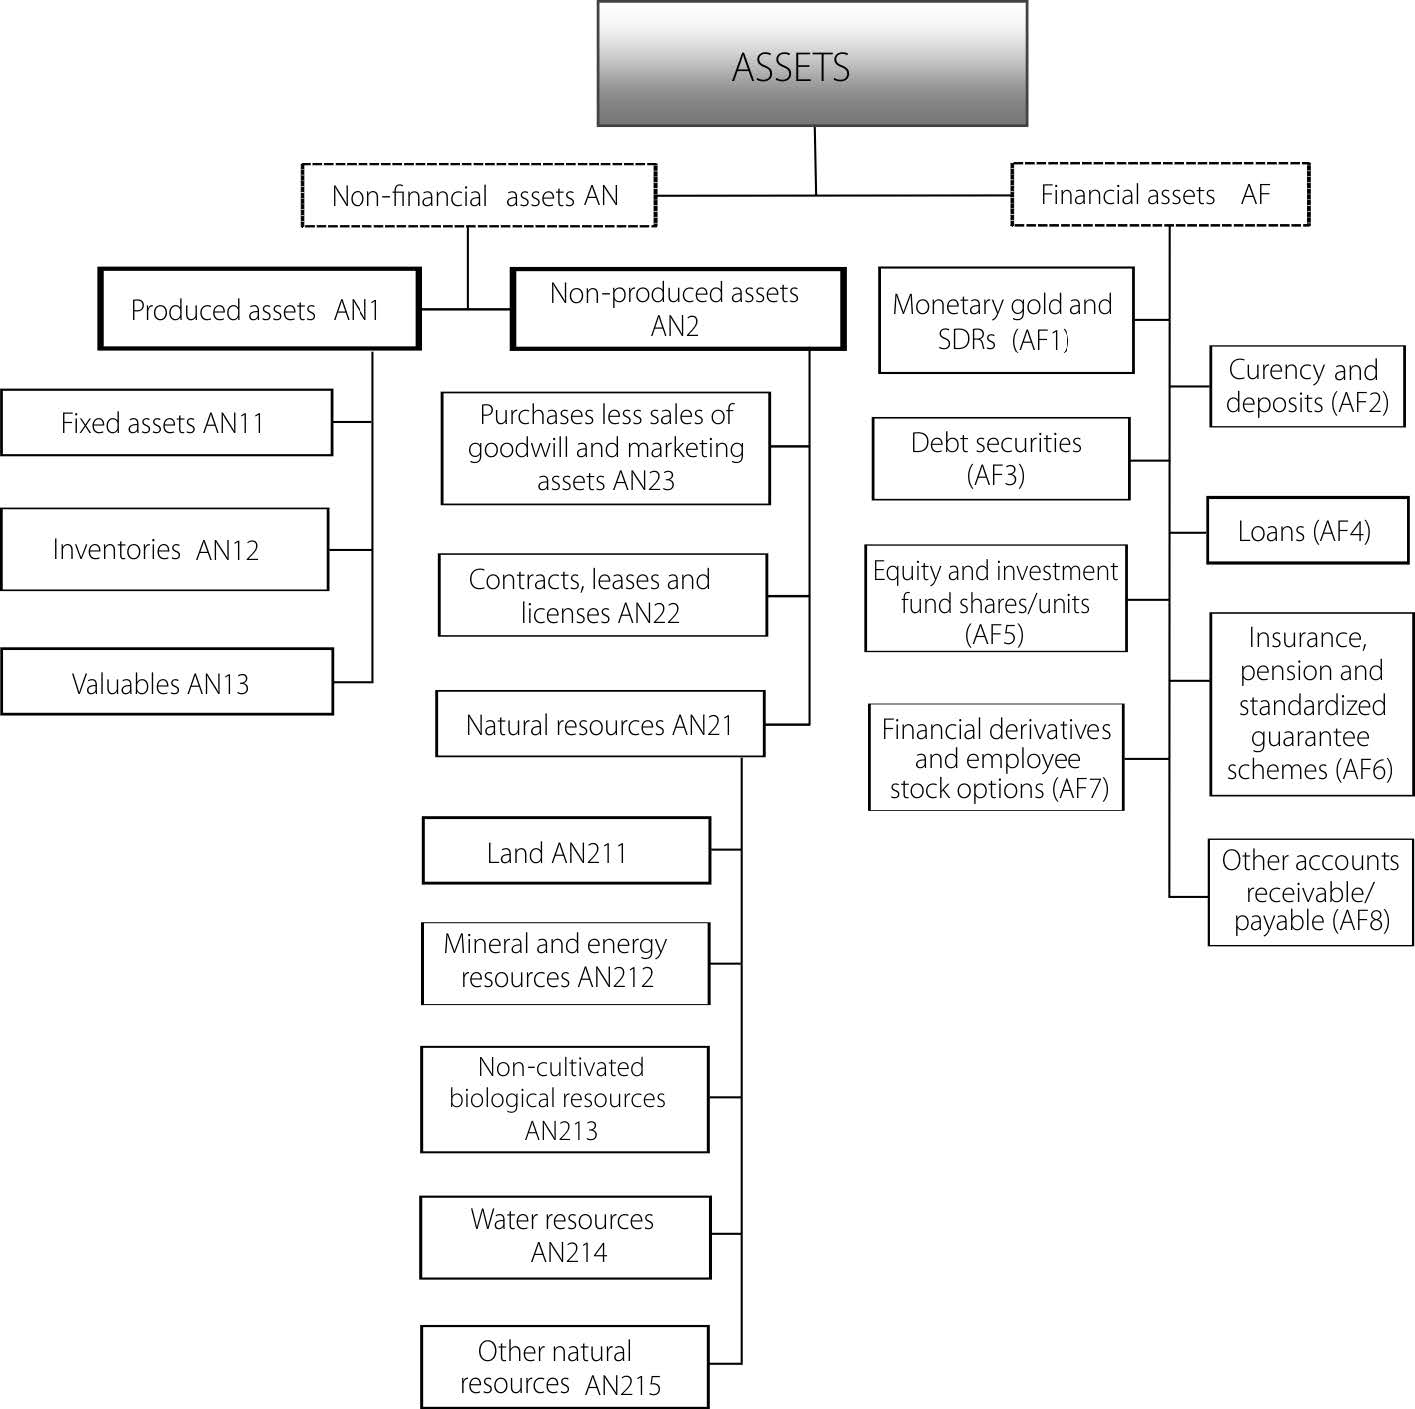
Fig. 1.3 General classification of assets in the SNA
Firstly, the SNA only records assets owned by institutional units22 , i.e., only resources with established ownership rights, the observance of which is ensured, are qualified as economic assets. It is important, in this respect, to distinguish between legal and economic ownership. A legal owner of items, such as goods and services, environmental resources, financial assets and liabilities, is an institutional unit having a statutory right to claim economic benefits related to those items. By contrast, an economic owner of items, such as goods and services, environmental resources, financial assets and liabilities, is an institutional unit having the right to claim economic benefits related to the use of the above items in the course of economic activity by assuming the associated risks (SNA, 2012, Chapter 10, paragraph 10.5).
Environmental resources, being non-financial non-produced assets, can be owned by private, public and other owners. Some of them, being public goods, cannot be recorded in the SNA because it is impossible to establish the ownership rights attaching to them (e.g., atmospheric air, oceans, etc.). This is also true of resources that cannot be actually owned by any specific institutional unit, notably, resources whose existence is unknown or which are known but are so remote and inaccessible23 that they are not effectively controlled by any institutional units. Numerous institutional studies in the sphere of natural resources and ecosystem services have found that serious difficulties in defining boundaries and evaluating assets are mainly due to the fact that ownership rights to natural resources are historically uncertain and not embedded in people’s minds (Fomenko G., Fomenko M., Arabova, Ladygina, 2013; Fomenko G., 2014). Therefore, situations related to the use of environmental resources require an analysis of interest groups.
Secondly, in order to be defined as economic assets, environmental resources have to provide economic benefits to their owners, taking account of technology, scientific expertise, economic infrastructure, available resources and market conditions. Therefore known stocks of resources (e.g., mineral deposits or food resources), the use of which will not be commercially viable in the foreseeable future, are not considered in the SNA to be economic assets. That is the case, despite the possibility that such stocks may later become commercially viable due to some unforeseen technology breakthroughs or material change of market prices. Biological resources that are classified as rare or threatened with extinction, and which are under government protection and generally excluded from economic exploitation are also not considered being economic assets.
So the System of National Accounts treats environmental resources as physical non-produced assets. They are reflected in accounts when they are owned (legally and economically) by institutional units and used by their owners for economic benefit. Data concerning such resources are reflected only in monetary terms; indicators of their stocks and use in physical terms (cubic meters of water and timber, wildlife populations, etc.) are ancillary and are employed in the SNA solely for obtaining monetary values. This approach inevitably reduces opportunities for analyzing the stock and use of environmental resources in all their variety and wealth; in particular, it fails to discover risks of depletion and, generally, cannot meet the needs of sustainable environmental management.
The first attempts to include data on consumption of natural resources in economic analysis were undertaken as early as the 1930s when accounts were created that embrace all indicators of economic activity, based on the theoretical work of Marshall, Keynes, Clark, Stone and others. Later, in the late 1960s, the results of research enabled the formulation of radically new approaches to the construction and the functioning of statistical systems by uniting accounts based on different kinds of capital (economic, environmental, human). This signaled a new understanding of the need to include environmental assets in national accounting systems, reflecting their major role in sustaining human life and the economy.
The UN Summit on sustainable development in 1992 proposed development of a system of integrated economic and environmental satellite accounting (Agenda 21, 1992) in furtherance of these pioneering works and in order to provide a more detailed record of environmental factors in the SNA, thus providing an adequate picture of relationships between the economy and the environment, which could be used as a basis for accumulating data on the available stock of environmental resources and their depletion through use. The first set of guidelines for environmental-economic accounts, published in 1993, contained basic principles for implementation of a supplementary system of integrated economic and environmental accounting, describing relations between the environment and the economy. The following years saw intensive efforts to improve methodology and practical approaches to formation of the SEEA as a critical and integral part of the SNA; guidelines for economic and environmental evaluation of fish, water, energy resources and ecosystem services were developed and approved (UN, 2012b; SEEA, 2015). In its present form the SEEA has solid methodological foundations, despite certain deficiencies of a theoretical and applied character (UN, 2014).
The SEEA, as a set of satellite accounts, ensures that national statistical systems are more oriented to reflecting processes and obtaining indicators that demonstrate whether processes, relations and interactions between the economy and nature harmonize with the principles of sustainable development. As far as existing philosophical limitations permit, the SEEA accounts provide the most consistent and complete recording and evaluation of the use of environmental resources and ecosystem services. Most importantly, considered from a methodological viewpoint and based on the theory of full economic value, the SEEA expands the scope of economic evaluation of environmental resources and ecosystem services, thus offsetting “market failures.”
SEEA implementation has greatly expanded the range of environmental resources captured by statistical observation. Special attention is paid to estimates in physical terms, which, for example, help to estimate and record depletion/degradation of assets, enabling respective adjustment of macroeconomic indicators. It therefore becomes possible to analyze interrelations between the economy and the environment, including expenditures on environmental protection, and to carry out ecosystem services accounting (Table 1.2). This content of the SEEA avoids many uncertainties and inaccuracies in obtaining estimated figures on stocks and flows of environmental resources and ecosystem services (in physical and monetary terms), thus preventing their underestimation.
In this way the SNA, supplemented by the system of satellite environmental-economic accounts, ensures greater credibility of information on environmental resources and ecosystem services in capital accounts and balance sheets for subsequent adjustment of economic macro-indicators. This provides more adequate evaluation of natural capital as a part of national wealth.
Table 1.2 Comparative features of the System of National Accounts and the System of Environmental-Economic Accounting
|
Criteria for accounting natural resources as assets |
Forms of accounting |
Accounting of “over-exploitation” of resources and pollution of the environment |
Issues to be addressed |
|
|
SNA |
Ownership rights Actual economic income |
Accounting in physical terms as a basis for monetary asset accounts |
“Over-exploitation” is only recorded under “Other asset changes” |
Recording of natural resources in capital accounts and the balance sheet |
|
SEEA |
Ownership rights are not obligatory. Potential opportunity to derive income Existence of non-economic benefits |
Physical accounting is necessary for all assets The goal is to identify asset depletion and/or degradation processes |
Macroeconomic indicators are reduced by the amount of asset depletion and/or degradation |
Analysis of mutual relationships between the economy and the environment Accounting of ecosystem services Formation of indicators reflecting environmental activities |
The SEEA satellite accounts supplement the main SNA accounts. They provide integrated accounts of environmental resources, which expand the scope of accounting of non-produced assets in the SNA without changing the boundaries of production processes. In this way, the accounts of stocks and flows of natural resources and ecosystem services in the SEEA are altered, but remain in agreement with SNA accounts.
The decision on creating the SEEA was adopted by the UN (United Nations Organization, 1991, paragraph 154e; United Nations Organization, 1993, Resolution 1, Annex II, paragraph 8.42). The Handbook of National Accounting sets out the basic principles for preparing such accounts. These principles are widely used for the analysis of environmental management efficiency in a number of countries (Brazil, Canada, Costa Rica, France, Germany, the Netherlands and Norway; some efforts to develop integrated evaluation of natural capital have been made in Australia, Japan, India, Indonesia, Mexico, New Zealand, Papua New Guinea, Sweden, Great Britain, the USA, Zimbabwe and other countries). At present, management of natural resources through the system of integrated environmental-economic accounts is a highly important path for the development of environmental management in many countries (Insert 1.1)
Insert 1.1
Two diametrically opposite positions can be distinguished among the many various approaches to development of accounting systems, which describe relationships between the environment and the economy. One of them presents statistical data on the state of the environment, which describe links between nature and the economy and their effect on the environment. Most of this statistical structure consists of descriptions of the natural environment, including, e.g., maps of specific regions (ecosystems or ecological zones). The information is usually presented in physical units. In the opposite approach attention in statistical sections is focused on the economy, while environmental-economic relations are only considered if they refer to specific economic transactions (e.g., expenditure on environmental protection or actual costs of accident response).
Source: Markandya, 1996a.
The Central Framework of the SEEA is a multipurpose conceptual basis for understanding relationships between the economy and the environment and for describing environmental assets. Based on agreed concepts, definitions, classifications and rules of accounting, the SEEA arranges information flows in an integrated and consistent form, thus providing interrelated indicators, which can be used for preparing statistical accounts and making reasonable decisions on a wide range of environmental management tasks (see Chapter 3). The SEEA thus provides information on a wide range of ecological and economic issues, including assessment of trends in use and availability of natural assets, scale of emissions and discharges to the environment caused by economic activities and the volume of economic activities intended to protect the environment. The Central Framework of the SEEA has a clear interdisciplinary character, uniting concepts and structures relating to the power engineering industry, subsoil management, forestry and water sectors, ecology, etc., and is closely linked to environmental and socio-economic statistics (Fig. 1.4).
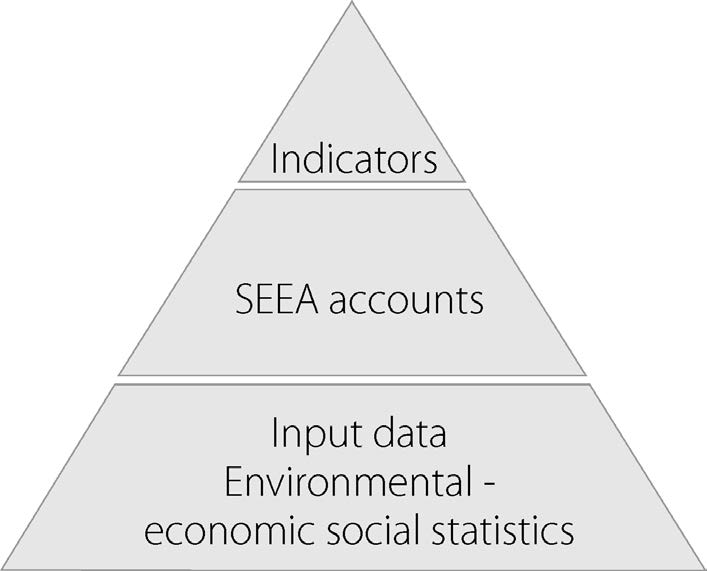
Fig. 1.4 Formation of environmental-economic indicators showing the state of natural resource supply and use in the economy
The Central Framework of the SEEA was developed to accord with other international standards, recommendations and classifications, including: the System of National Accounts 2008; Guidelines for Balance of Payments and International Investment Position; International Standard for Industrial Classification of all Economic Activities; Central Product Classification; Framework for Development of Environmental Statistics (these can be supplemented, if necessary).
The SEEA Central Framework uses a number of basic provisions to organize and integrate information on the state and changes in various stocks and flows in the economy and the environment.
Firstly, measurements are made by transforming inputs into accounts and tables in three directions:
1) physical flows of materials and energy inputs in the economy and between the economy and the environment;
2) environmental assets and changes in these assets;
3) economic activities and transactions related to the environment.
The concepts of “economy” and “environment” are of great importance in this respect.
Secondly, it is accepted that the economy operates by producing and importing goods and services, which are, respectively:
1) consumed by enterprises, households or government institutions;
2) exported to other countries;
3) stored for future consumption or use.
The economy is presented in the form of stocks and flows to enable its measurement in the SEEA. Measurement of flows is focused on economic activities such as production, consumption and accumulation. It is important to establish the boundaries of the production sphere: all produced goods and services (products)24 are deemed to be factually “inside” the economy. Accordingly, flows between the economy and the environment are understood to be flows, which cross the production boundary.
Thirdly, stocks of economic assets are used as inputs to production processes and as a source of material benefits for economic units, including households. Economic assets are divided into produced assets (arising from economic activities, e.g., buildings, equipment, etc.) and non-produced (which are not results of production, e.g., land, mineral deposits, water resources, etc.).
The economic value and quantity of stocks of assets (e.g., buildings, natural resources and bank deposits) changes over time. Those changes are reflected in flows and recorded in accounts either as transactions (e.g., acquisition of buildings and land plots) or as other flows.
Fourthly, stocks and flows of environmental assets are considered being an integrated whole. As stocks, environmental assets include all living and non-living components of the Earth, together constituting the biophysical environment, including all kinds of natural resources and the ecosystems in which they are situated. As flows, environmental assets constitute the source of all economic inputs, including natural resources (minerals, timber, fish, water, etc.) and other natural resources absorbed by the economy (e.g., the energy obtained from sun and wind and the air used in combustion processes).
Fifth, when measuring physical flows, special attention is paid to recording the flows of materials and energy resources which go into and out of the economy and the flows of materials and energy resources within the economy. In a broad sense, flows from the environment to the economy are recorded as coming from natural sources; flows within the economy are recorded as flows of products; while flows from the economy to the environment are counted as residuals (e.g., solid waste, atmospheric emissions and return flows of water)25 (Fig. 1.5)
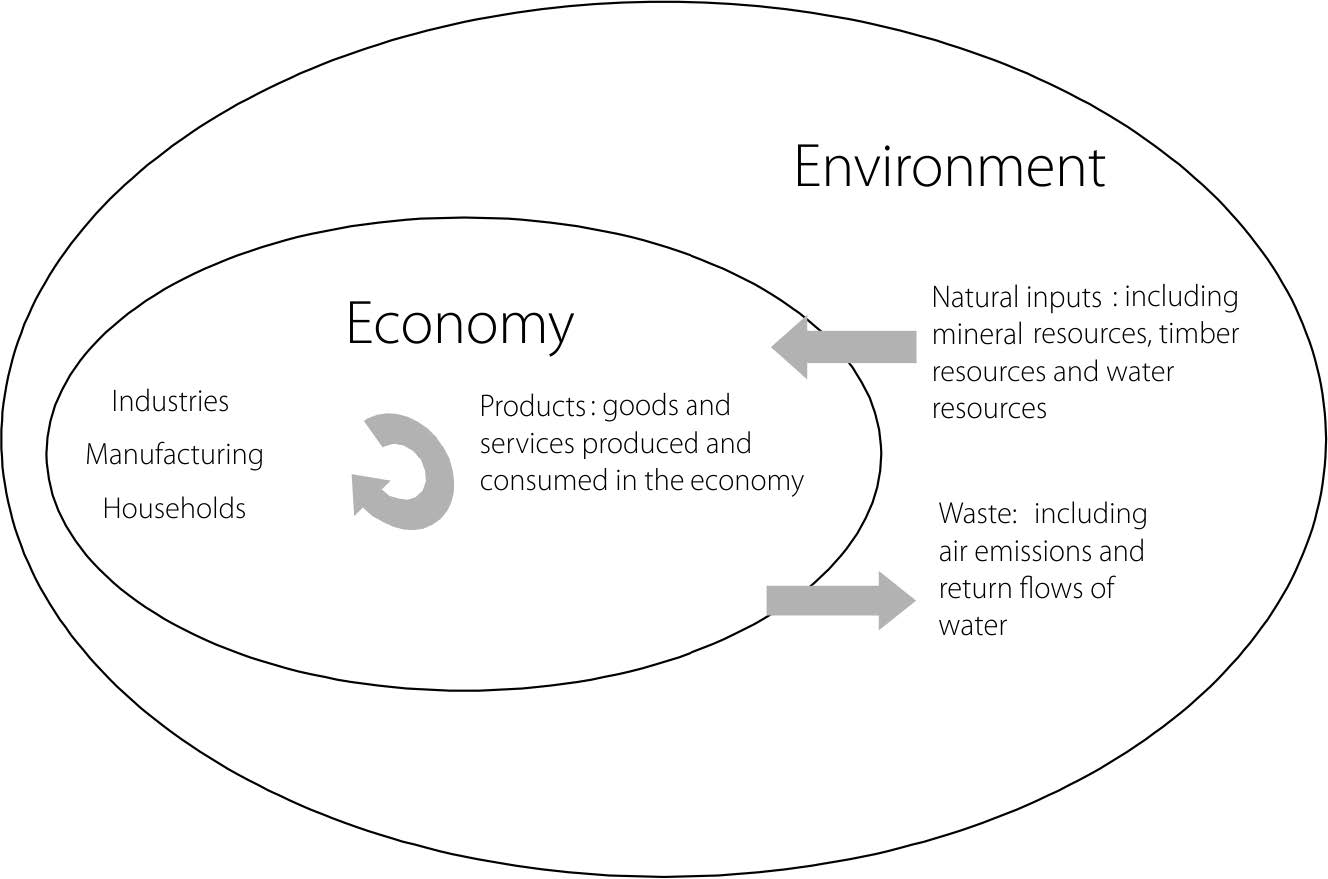
Fig. 1.5 Main flows of natural inputs, products and residuals
The boundary used to divide these flows is based on the production boundary.26 From a geographical perspective, the measurement boundary corresponds to the economic territory of a country and economic activity is attributed based on the residence of economic units.
Six, the specifics of measurement of stocks are determined by the specific features of environmental assets which, in a most general form, are defined as naturally occurring living and non-living components of the Earth, together constituting the biosphere environment, and capable of providing benefits to human beings.
Environmental assets are inevitably related to the economy: they are either engaged and transformed in the process of production activity or perform a supporting function, so they are to be viewed in two aspects.
Firstly, environmental assets provide materials and space for all economic activities (e.g., mineral and energy resources, timber resources, water resources and land). This reflects material benefits from the direct use of environmental assets as natural inputs by enterprises and households. This does not take account of non-material benefits from the indirect use of environmental assets (e.g., ability of water to purify itself, to store carbon, etc.).
Secondly, environmental assets are considered with focus on the interaction of individual assets within ecosystems and on the broad set of material and non-material benefits that accrue to the economy and other human activities from flows of services provided by ecosystems. 27 In this perspective, ecosystem accounts can be formed, which reflect the capacity of living components within their non-living environment to work together to generate flows known as ecosystem services. These services are defined as the contributions of ecosystems to benefits that are used in economic and other human activities. Despite their multifarious nature, ecosystem services can be divided into three groups:
- provisioning services (e.g., timber from forests);
- regulating services (provided, e.g., by forests when they act as carbon sinks);
- cultural services (such as the enjoyment provided to visitors to a national park) (see, e.g., Millennium Ecosystem Assessment, 2003).
Degradation of ecosystems by economic and other human activity means that they may be not able to generate the same range, quantity or quality of ecosystem services on an ongoing basis. Therefore, the formation and maintenance of ecosystem accounts provides an information basis for analyzing the extent to which economic activity can reduce the ability of ecosystems to generate ecosystem services.
In addition to measuring the stock of environmental assets and flows between the environment and the economy the Central Framework SEEA 2012 records flows associated with economic activities related to the environment: expenditures on environmental protection and resource management, production of environmental goods and services (e.g., filters to reduce air pollution). So environmental-economic activity is distinguished and presented in the form of so-called functional accounts (e.g., accounts recording environmental protection expenditures). This ensures a more comprehensive view of environmental features of the economy in statistical systems.
The Central Framework SEEA 2012 organizes and integrates information on various stocks and flows in the economy and the environment in a series of tables and accounts and their combinations:
- supply and use tables in physical and monetary terms showing flows of natural inputs, products and residuals;
- asset accounts for individual environmental assets in physical and monetary terms showing the stock of environmental assets at the beginning and the end of each accounting period and changes in the stock;
- a sequence of economic accounts highlighting depletion-adjusted economic aggregates;
- functional accounts recording transactions and other information about economic activities undertaken for environmental purposes.
In order to diversify the generalizations and get a more detailed picture of relations between environmental-economic features and processes in the social sphere, the analysis of data contained in the tables and accounts can be extended by linking the tables and accounts to relevant employment, demographic and other information.
The Central Framework SEEA 2012 does not require compilation of every table and account for all environmental assets or environmental elements. Instead, it can be modular, taking into account those aspects in the country’s environment that are most important for the specific territory. At the same time, the ultimate goal is to obtain full accounting of the environmental-economic structure of the country and to provide information on issues of global concern using a common measurement framework.
1.3.1.1. Supply and Use Tables
Monetary supply and use tables in the SEEA record all flows of products in an economy between economic units in monetary terms. Many of the product flows may relate to the use of natural inputs from the environment (e.g., the manufacture of products from wood) or to activities and expenditures associated with the environment (e.g., clean-up of effluents). Products enter (“are supplied to”) the economy (become its inputs) when they are produced by industries in the national economy (a flow known as output) or brought in from the rest of the world (a flow known as imports).
A product can be used in a number of ways. For instance, products can be:
1) used by other industries to make different products (a flow known as intermediate production);
2) consumed by households (a flow known as household expenditures on final consumption);
3) consumed by the government (a flow known as government expenditures on final consumption);
4) sold to the rest of the world (a flow known as exports);
5) held as inventories for later use;
6) used as assets (e.g., machines) over a longer period to produce other products (such longer-term uses are known as gross capital formation).
The monetary supply and use table is divided into two parts: a supply table and a use table (Table 1.3). The listed flows are classified by type of product in the rows and by type of economic unit (enterprises, households, government) and the rest of the world in the columns (it should be mentioned that accumulation flows are not recorded because, although they concern resources of the current accounting period, they are not used in the current period, but instead accumulate for future use or sale to economic units and the rest of the world in the form either of inventories or of fixed assets). Enterprises are classified by industry depending on their core activity.
Table 1.3 Basic form of monetary resource and use table

Note: Gray cells are null by definition.
Source: UN, 2012a, p. 16.
According to the SEEA methodological approach, when products are withdrawn from inventories in subsequent accounting periods, they are effectively resupplied to the economy at that time; the change in inventories (additions to inventories less withdrawal) during an accounting period is recorded as use of products. Overall, the total supply of each product must equal the total use of each product. This equality between the total resource supply and total use of each product is known as supply and use identity. It is the fundamental identity in both monetary supply and use tables and in physical supply and use tables.
The row of the supply table shows that for each product total supply of resources is equal to output plus imports. The row of the use table shows that total use is equal to intermediate consumption plus final consumption expenditure of households plus final consumption expenditure of government plus gross capital formation plus exports.
Physical supply and use tables are used to assess how the economy supplies and uses natural resources and materials as well as to examine changes in production and consumption patterns over time. Combination with data from monetary supply and use tables enables the study of changes in productivity and intensity of the use of natural resources and the release of residuals. The structure of the physical supply and use tables is similar to the monetary supply and use tables; extensions are made to incorporate a column for the environment and rows for natural inputs and residuals (Table 1.4)
Although the broad structure and underlying principles of the physical supply and use tables are the same regardless of whether the table is measuring flows of energy, water, residuals or materials, different rows and columns may be used for each of these subsystems of physical flows. For example, the physical supply and use table for flows of residuals (as a part of the supply table) comprises several columns (collection and treatment of waste and other residuals; residual flows from the environment; the rest of the world; total supply) as well as two rows (solid waste formation and products based on solid waste by type).
Table 1.4 Basic form of a physical supply and use table
Supply table
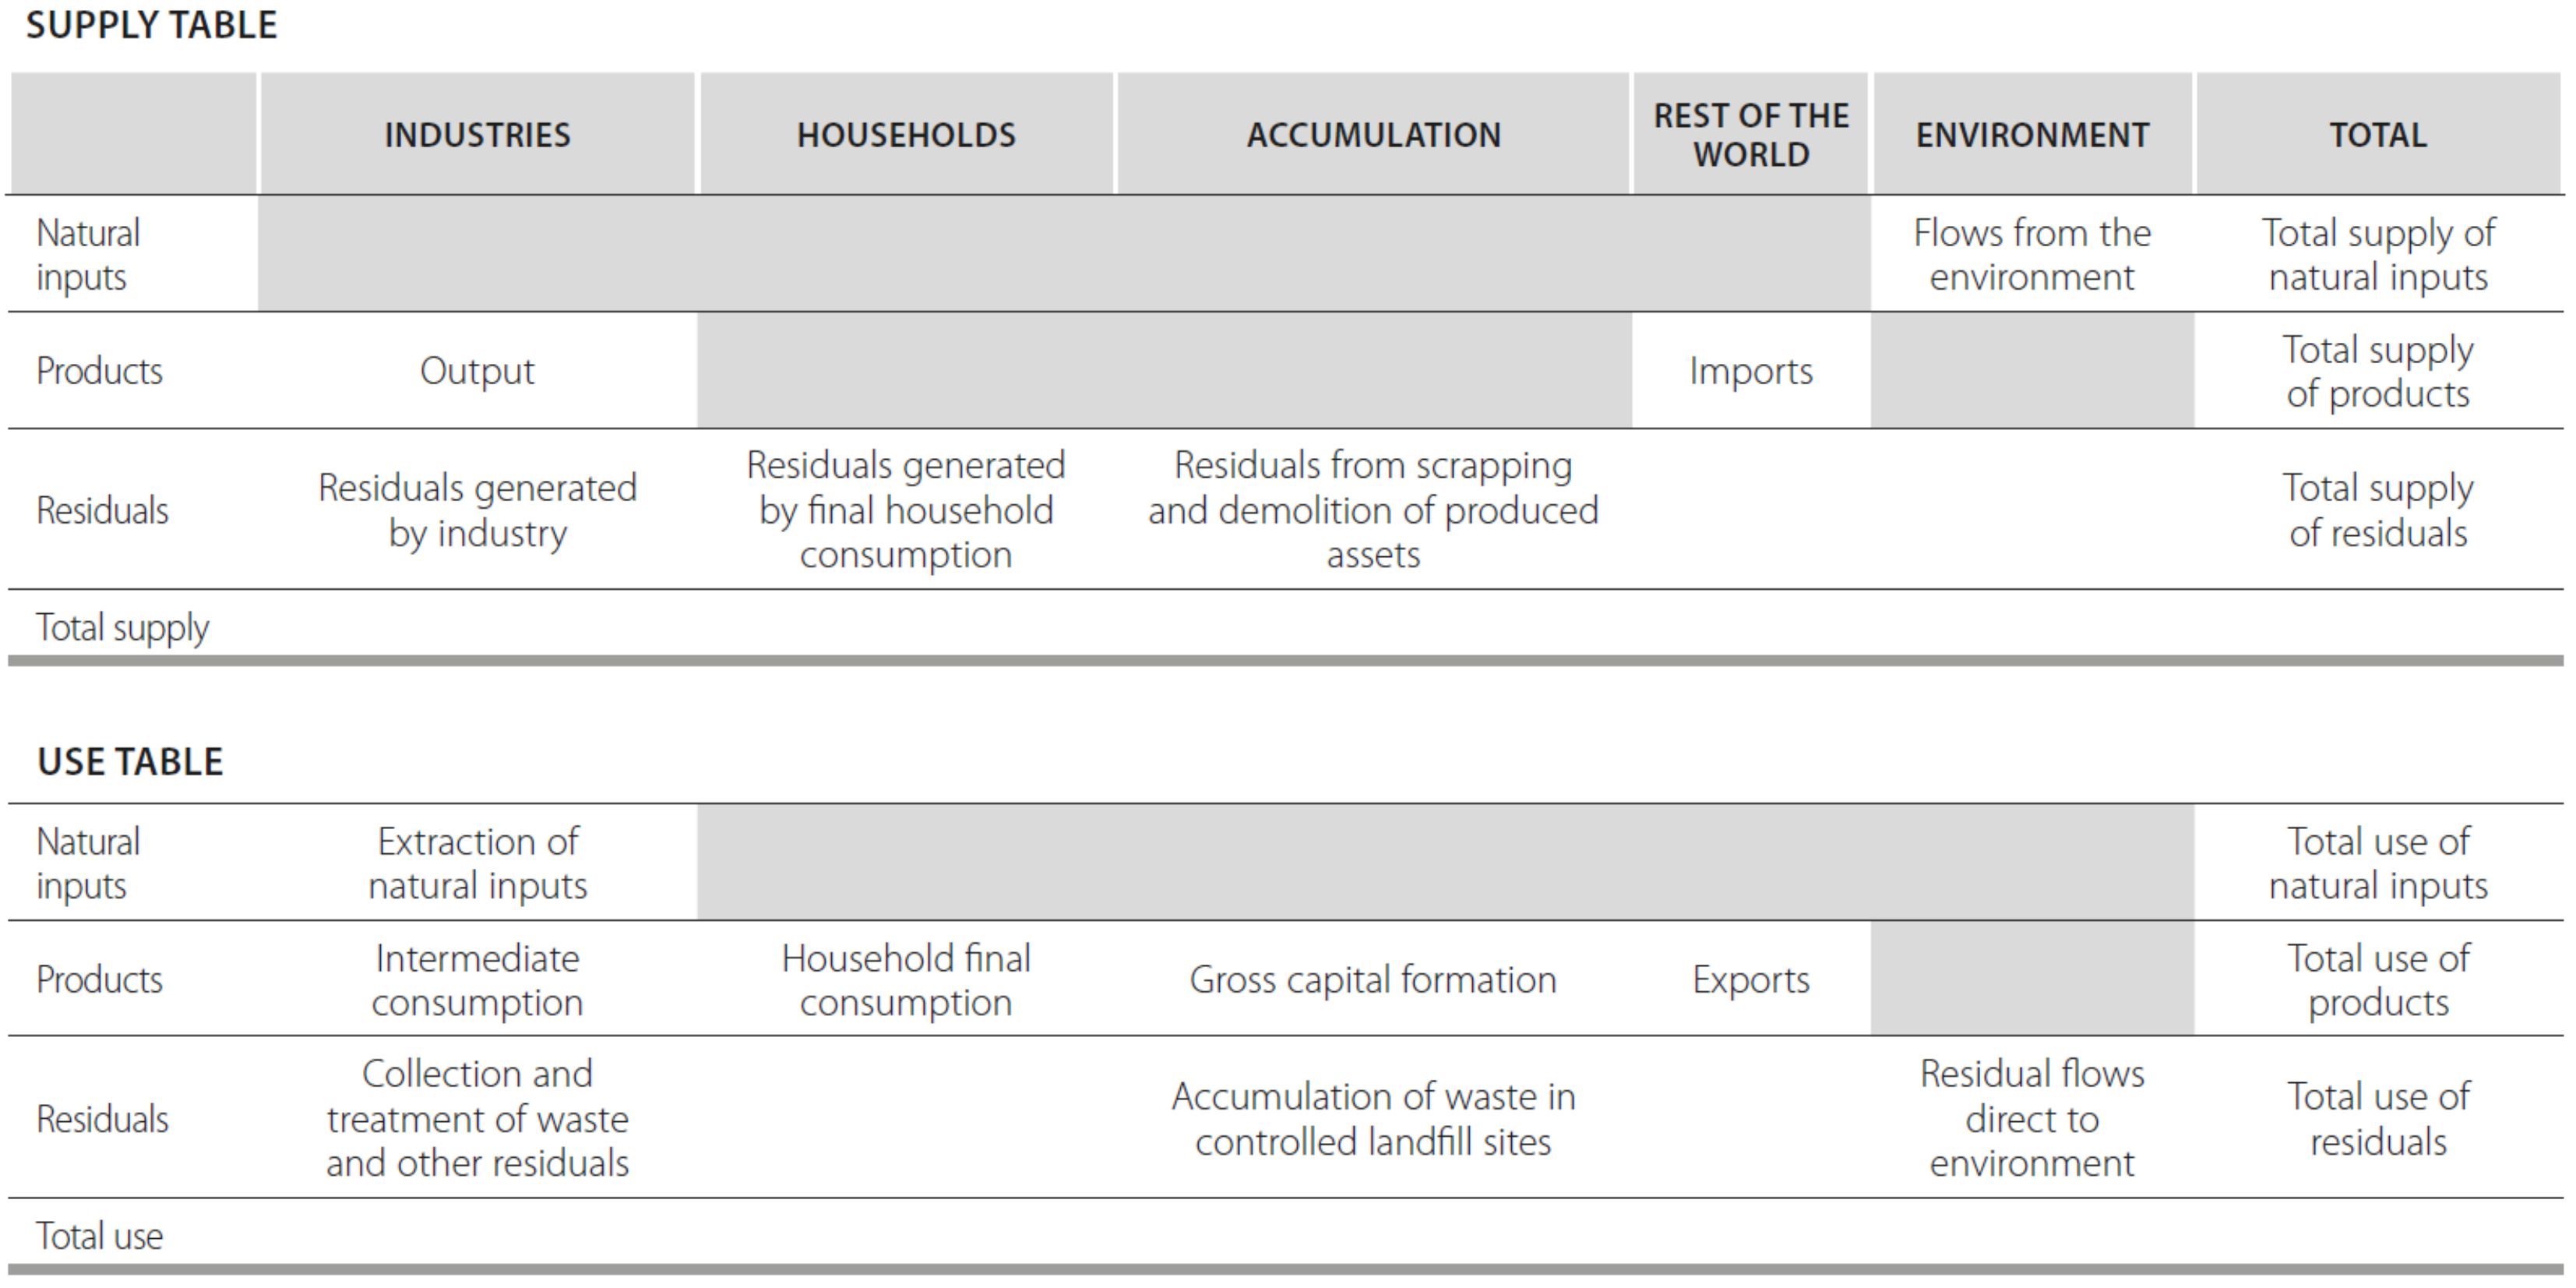
Source: UN, 2012a, p. 17.
Within the tables, the supply and use identity that applies in monetary terms also applies in physical terms. Thus, for each product measured in physical terms (e.g., cubic meters of timber), the quantity of output and imports (“Total supply of products”) must equal the quantity of intermediate consumption, household final consumption, gross capital formation and exports (“Total use of products”). The equality between supply and use also applies to the total supply and use of natural inputs and the total supply and use of residuals.
In addition to the supply and use identity, the physical supply and use table incorporates an additional identity concerning flows between the environment and the economy (input-output identity), which requires that the total flows into the economy, or into an enterprise or household, over an accounting period, are either returned to the environment or accumulate in the economy. For example, flows of energy to an enterprise in the form of electricity or petroleum products must be released to the environment after the energy has been used (as losses of residual heat) or stored (as inventories for future use) or incorporated in non-energy products (e.g., petroleum products used to manufacture plastics).
Both the supply and use identity and the input-output identity are based on the law of conservation of mass and energy, which states that the mass and energy of a closed system will remain constant. The implication for accounting is that, in theory, mass and energy flows must balance across natural inputs, products and residuals.
Unlike monetary flows, which are measured in currency units, physical flows are generally measured in a variety of different units. While it is conceptually possible to compile a complete physical supply and use table for all material flows in an economy using a single measurement unit (e.g., tons), it is not the usual practice.
1.3.1.2. Asset accounts
Asset accounts are designed to record the opening and closing stock of environmental assets, primarily to assess whether the current patterns of economic activity are depleting and degrading the available environmental assets. So they provide information for the efficient management of environmental assets. Also, monetary valuations of natural resources and land can be combined with valuations of produced assets and financial assets (in the SNA balance sheets) to provide broader estimates of national wealth. The structure of asset accounts starts with the opening stock of environmental assets and ends with the closing stock of environmental assets (Table 1.5)
Table 1.5 Basic format of asset account
|
Opening stock of environmental assets |
|
Additions to stock |
|
Growth in stock** |
|
Discoveries of new stock** |
|
Upward reappraisals** |
|
Reclassification |
|
Total additions to stock |
|
Reductions of stock** |
|
Extraction |
|
Normal loss of stock |
|
Catastrophic losses** |
|
Downward reappraisals** |
|
Reclassification |
|
Total reductions of stock |
|
Revaluation of stock* |
|
Closing stock of environmental assets |
* Only applicable for assets in monetary terms
** As applied to the research theme, growth in stocks may be due to the discovery of new deposits, natural increase in non-cultivated biological resources; discovery of new stocks can be due to the discovery of new deposits and assurance of their viability; upward and downward reappraisals occur due to price changes; catastrophic losses may be caused by natural or man-made crises; reduction of stocks may result from soil exhaustion.
Source: UN, 2012a, p. 20.
Changes between opening stock and closing stock in physical terms are recorded as either additions to stock or reductions of stock; the character of such addition or reduction is indicated, if possible. The same entries are included in monetary terms, with the addition of an entry to account for monetary revaluation of environmental assets. This entry shows changes in the value of assets over an accounting period, which are driven by movements in the current prices of those assets.
There are numerous and diverse reasons why the quantity and value of environmental assets change over an accounting period. Many of these changes are caused by interaction between the economy and the environment in the context, e.g., of extraction of minerals or the planting of timber resources. Other changes occur due to natural phenomena, e.g., natural increase of non-cultivated biological resources (forest and animals) or losses caused by catastrophic events, which may have natural or man-made causes.
Some changes between the opening and closing stocks of a reporting period have more to do with the accounting practice, including changes caused by improved measurement (reappraisal) and those involving the assignment of assets to different categories (reclassification). Examples of reappraisal include the discovery of new mineral deposits, verification of their efficiency, and reappraisal of the size and quality of mineral reserves. Examples of reclassification would be entries recording changes in land use between agriculture and urban.
As a rule, asset accounts are compiled for individual types of environmental assets. In monetary terms, there may a need to aggregate the values of all environmental assets at the beginning and end of the accounting period. Such aggregates can be presented in the form of balance sheets, which can be combined with the value of other assets (e.g., produced assets and financial assets) and liabilities to obtain an overall measure of the net wealth of an economy.
There are close links between the supply and use tables and asset accounts, a fact which emphasizes the integrated nature of the Central Framework of the SEEA 2012 (Table 1.6).
Table 1.6 Links between supply and use tables and asset accounts
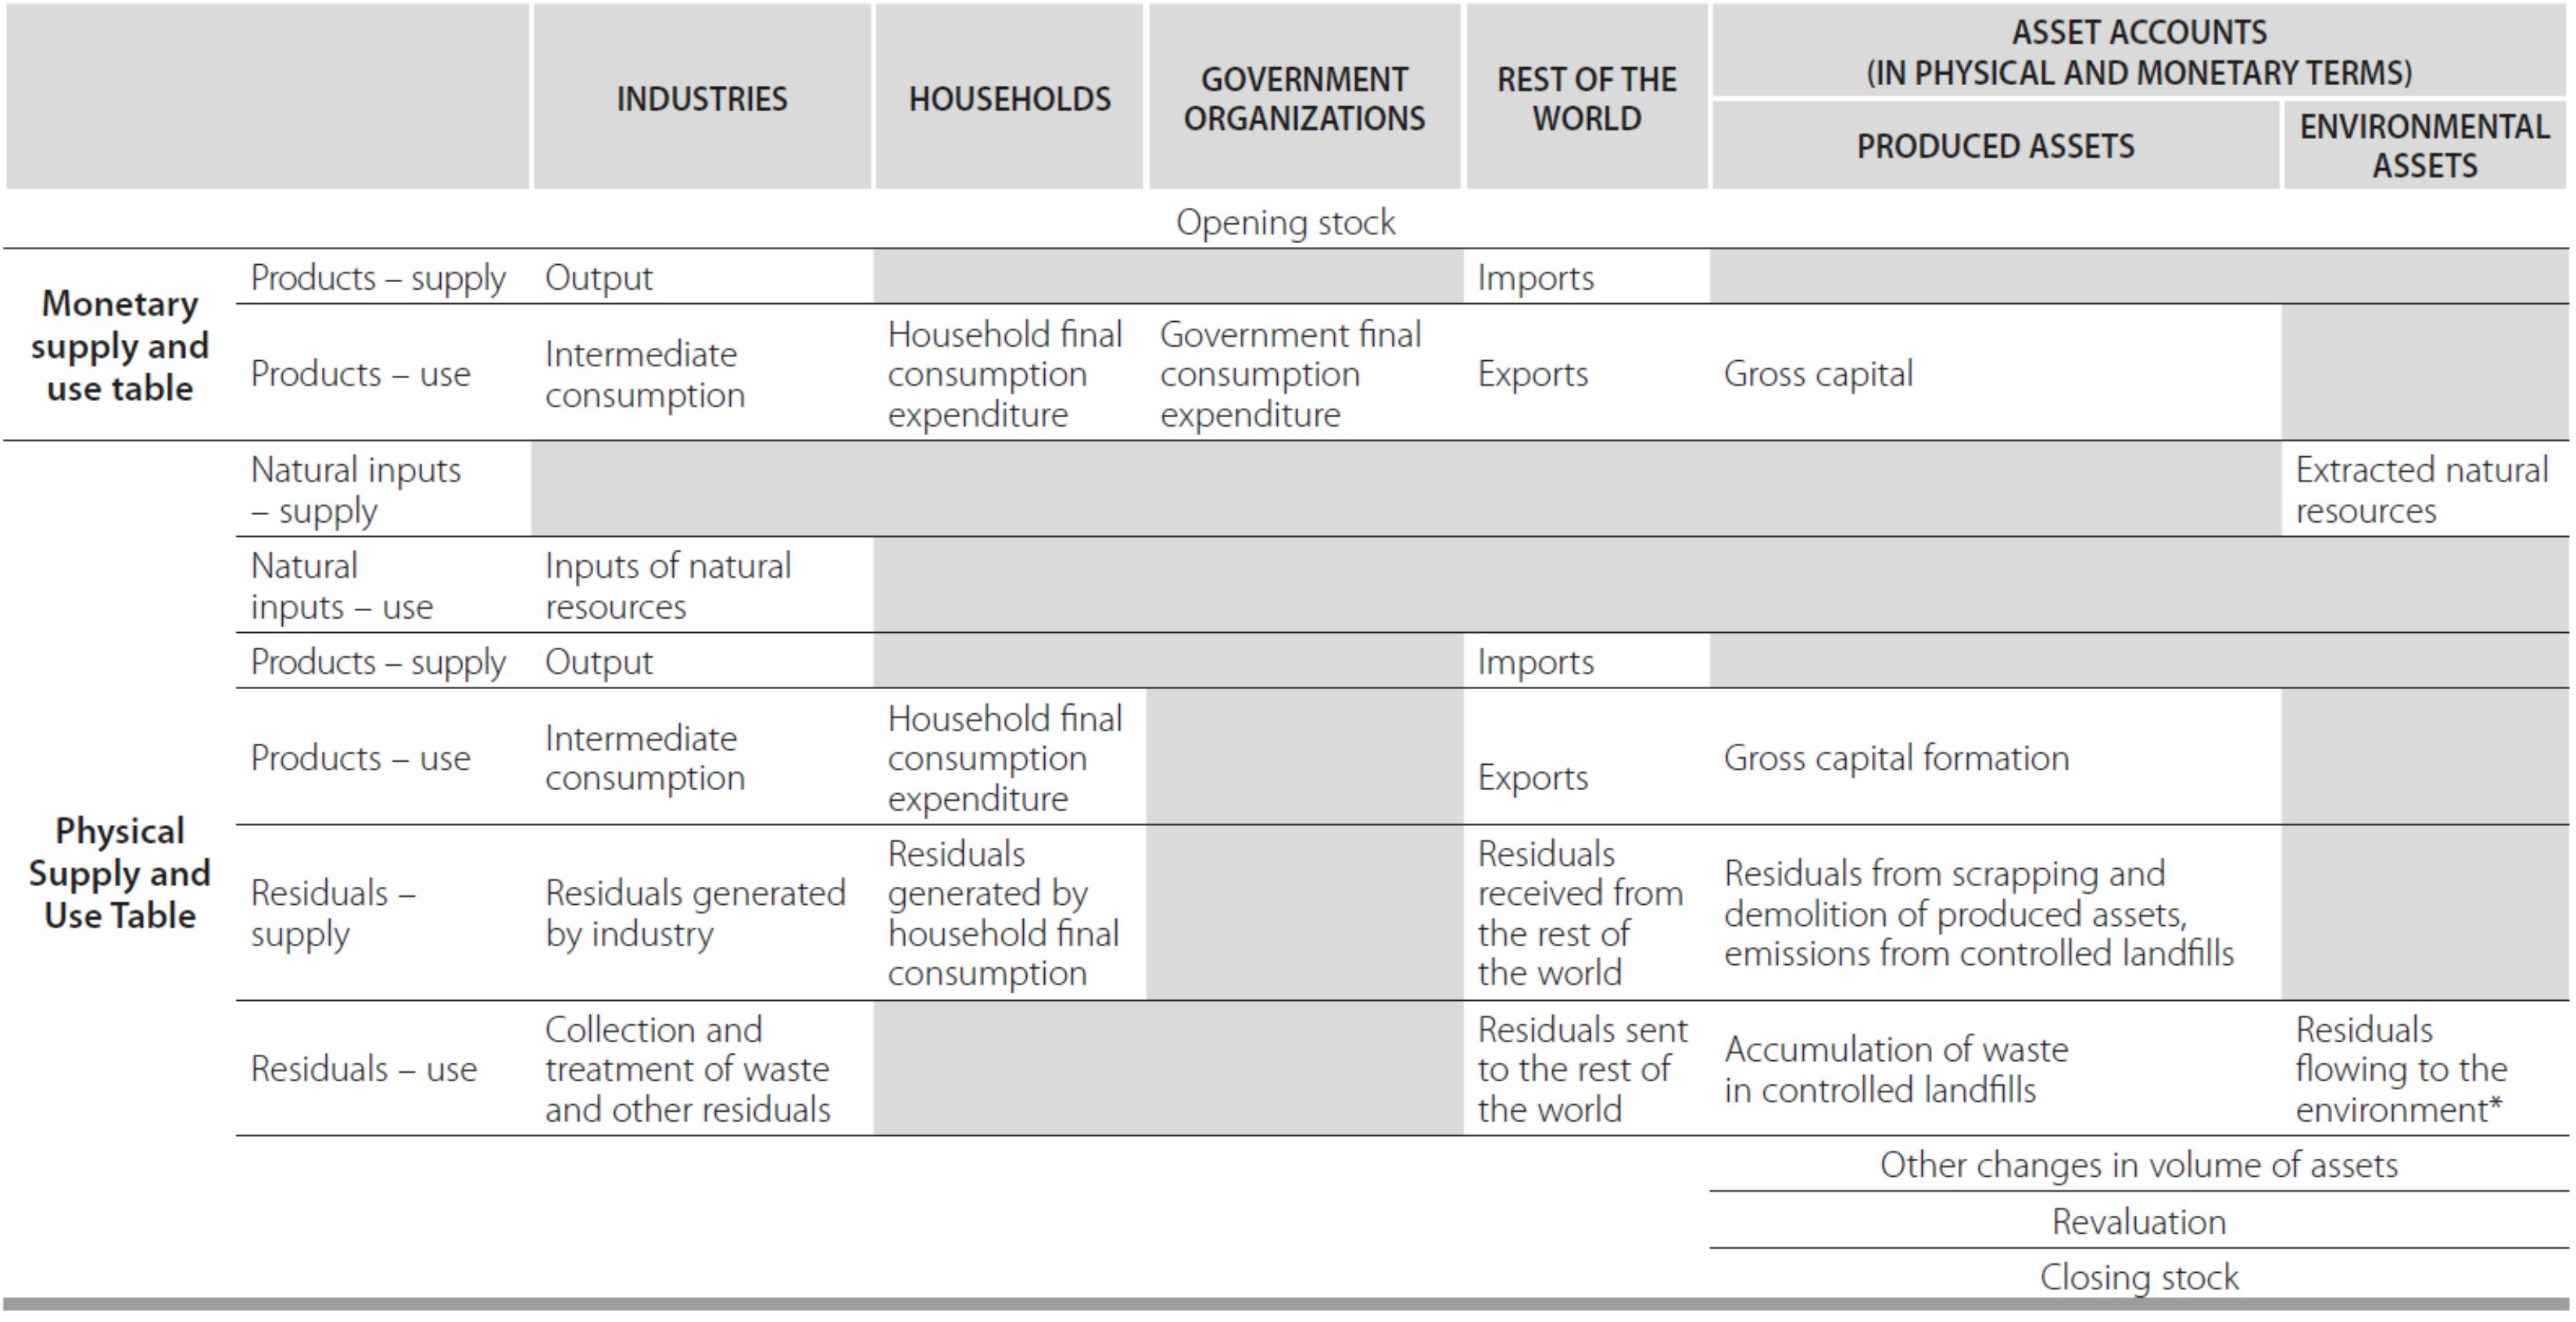
Note: Dark gray cells are null by definition.
*Although residual flows (e.g., emissions into the atmosphere) are not flows of environmental assets, they can affect the capacity of environmental assets to deliver benefits. Change in the potential of environmental assets can also be recorded in the cell labeled “Other changes in volume of assets.”
Source: UN, 2012a, p. 22.
The main change in Table 1.6 from the point of view of supply and use is that the flows entered in the columns “Accumulation” and “Environment” of the supply and use tables are transferred to the asset accounts (two right-hand columns). The opening and closing stocks for a given period appear at the top and bottom of the table, respectively. Some changes in the stocks are also recorded in the supply and use tables. For example, gross capital formation and natural inputs are included in both asset accounts and in supply and use tables. Some changes in stocks are not recorded in the supply and use tables, and they are grouped in the cell named “Other changes in volume of assets.” Examples of such changes include discoveries of mineral resources, losses of assets following catastrophic natural events and changes in the values of assets due to price changes (revaluation).
Special attention should be paid to the row showing the use of residuals.
Neither the accumulation of residuals in controlled landfills nor the flow of residuals to the environment is recorded in asset accounts for individual environmental assets. However, more broadly, the accumulation of residuals in the economy does represent an increase in a stock, and the flow of residuals to the environment may affect the capacity of environmental assets to deliver benefits.
1.3.1.3. Sequence of economic accounts
In monetary terms, supply and use tables and asset accounts record much of the information used to assess interactions between the economy and the environment. However, a range of other monetary transactions and flows are also of interest (rent for the extraction of natural resources, environmental taxes and payments of environmental subsidies, grants from government units to other economic units to support environmental protection work, etc.). These flows are recorded in the sequence of economic accounts, which, understandably, are compiled only in monetary terms (these transactions do not have a direct underlying physical base).
The sequence of economic accounts in the SEEA follows the broad structure of the sequence of accounts in the SNA. A particular feature of the sequence of accounts is the presentation of balancing items. Typically, there is not a balance between relevant inflows and outflows. That is why balancing items are introduced which, as well as being measures of economic activity in themselves, also help to align the whole sequence of accounts. Derivation of depletion-adjusted balancing items and aggregates within the sequence of economic accounts is of particular importance. Depletion-adjusted measures are not part of the balancing items and aggregates measured in “net” terms in the SNA (i.e., after the deduction of fixed capital consumption) and they require additional calculation of the cost of exhausting natural resources. (Table 1.7)
Table 1.7 Basic SEEA sequence of economic accounts

Source: UN, 2012a, p. 24.
The sequence of economic accounts starts from the production account, which is prepared using the output and intermediate consumption entries from the monetary supply and use table. The balancing item here is value added (output less intermediate consumption). At an economy-wide level, the main related aggregate from the production account is gross domestic product. Fixed capital consumption and depletion are deducted from gross value added and GDP to obtain measures of depletion-adjusted net value added and depletion-adjusted net domestic product.
The sequence continues with the distribution and use of income accounts, which contain information on how value added is allocated to economic units as either remuneration of employees or gross operating surplus, as well as information on flows of other income and related payments (flows of taxes, subsidies, interest and rent for the use of land or other environmental assets). The total amount of disposable income (all income received less all income paid) is available for final consumption expenditure. The balancing items for the income accounts are operating surplus (value added less compensation of employees and less taxes with deduction of subsidies) and savings (disposable income less final consumption expenditure). As in the production account, depletion of environmental resources can be deducted from the balancing items of net operating surplus and net savings. The key aggregates from these accounts in gross terms are gross national income and gross national savings, both of which can be adjusted for depletion and fixed capital consumption to form depletion-adjusted measures.
The next account to be considered is the capital account. This account records how savings are used to acquire assets, including produced assets and environmental assets. It therefore includes the acquisition and disposal of environmental assets, and specifically transactions in land and cultivated biological resources such as plantations and livestock. If the expenditure on assets is less than the amount of savings, then an economy will have resources available to lend to the rest of the world. If the expenditure on assets is more than the amount of savings, then an economy will need to borrow from the rest of the world. The balancing item for the capital account is therefore known as net lending/borrowing.
The sequence of accounts is completed by the financial account, which records transactions involved in lending and borrowing. The financial account shows all transactions with financial assets and liabilities (e.g., deposits, loans, shares and equities). The balance of these transactions is net lending/borrowing, as in the case of the capital account balancing item.
In the SEEA the sequence of economic accounts is oriented to the specific task of showing how incomes from the extraction of natural resources and the economy as a whole are impacted by the cost of depletion.28 In particular, the SEEA provides depletion-adjusted estimates of operating surplus, value added and savings at both the economy-wide level and for institutional sectors. Since there is only one amount of depletion for a given resource, it must be allocated between the relevant units in the accounting framework.
The following accounting treatment is recommended for the SEEA:
a) Recording of the total cost of depletion in the production and generation of income accounts of the extractor as deductions from value added and operating surplus. This ensures that the analysis of extractive activity and economy-wide aggregates of operating surplus and value added fully account for the cost of depletion. Further, since the government has no operating surplus in regard to extractive activity, not recording depletion in the production account of the government ensures that estimates of government output (which are calculated based on input costs) are not increased owing to depletion.
b) Recording the payment of rent by the extractor to the government in the primary income allocation account. This entry is standard for the SNA.
c) Recording an entry entitled “Depletion borne by government” in the primary income allocation account to reflect:
1) that the rent earned by the government included the government’s share of total depletion, which must be deducted to measure the depletion-adjusted savings of government;
2) that the depletion-adjusted savings of the extractor would be understated if the total amount of depletion was deducted in the extractor’s accounts. Another way of viewing this entry is to consider that the rent earned by government must be recorded net of depletion (i.e., as depletion-adjusted rent) in the derivation of depletion-adjusted savings of the government.
An example of such entries is given in Table 1.8. It is important to note that this form ensures that the sum of the institutional sector entries for depletion-adjusted aggregates is equal to the same aggregates calculated at the economy-wide level.
The values of depletion shown for each unit should be consistent with the change in net worth of each unit in relation to environmental resources (assuming the sustainable character or absence of other changes in the stock of resources). Thus, if government collects a 40 percent share of the resource rent (through payment of rent by extractors), then the depletion costs borne by government will be 40 percent of the total measured depletion. In making this calculation, it is assumed that the government’s share of future resource rent remains constant. If this share is expected to change in the future, then the rent earned and depletion borne by government should be adjusted to reflect these changes.
Table 1.8 Entries for allocating income from nature resources and their depletion
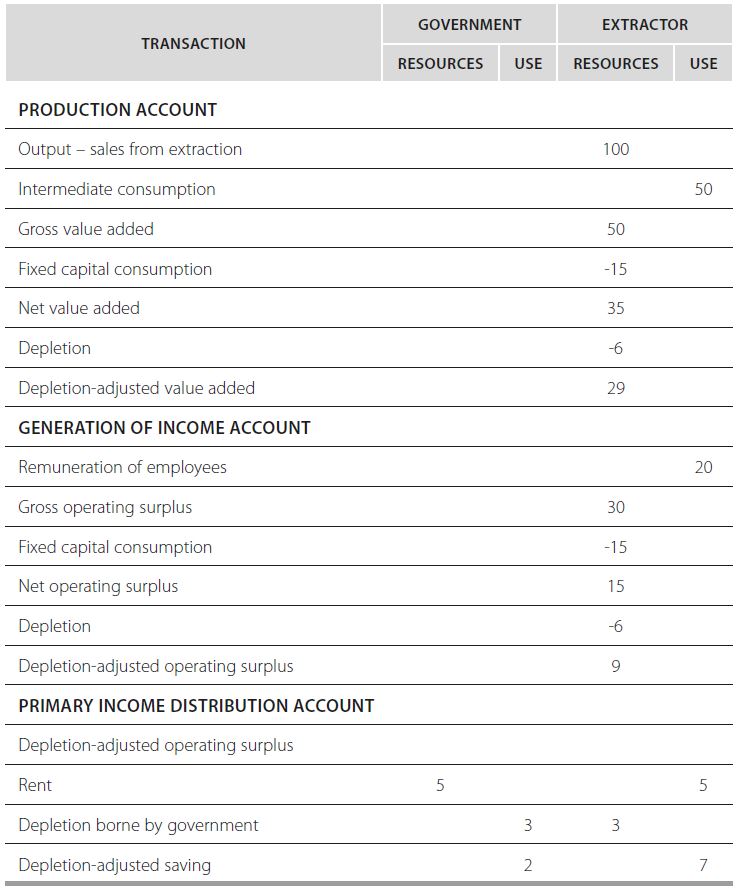
Source: UN, 2012a.
The associated balance-sheet entries may be made in different ways depending on the nature of the analysis and on the institutional arrangements in an administrative territory. In any presentation, the allocation of assets and the resulting estimates of institutional sector net worth should reflect the expected future income streams for each unit from the extraction of resources.
1.3.1.4. Functional accounts
The conventional industry and product classifications used in compiling tables and accounts in the SEEA do not necessarily highlight environmental activities or products. It is therefore necessary to prepare functional accounts. The first step is to define the activities, goods and services that have an environmental purpose (i.e., whose main purpose is to reduce or eliminate pressures on the environment or to make more efficient use of natural resources). In the second step, relevant information in the monetary supply and use tables and the sequence of economic accounts is reorganized to enable clear identification of transactions associated with environmental activities and environmental goods and services.
Such identification of environmental activities and products helps to present information related to economic measures that respond to ecological challenges. Flows reflecting output of environmental goods and services and expenditures on environmental protection and resource management are of particular interest as are flows of environmental taxes and subsidies.
Supply and flow accounting is of key importance in the Central Framework of the SEEA 2012. Physical flows showing movement and use of materials, water and energy include natural inputs, products and residuals.
Natural inputs are all physical inputs that are moved from their location in the environment as a part of economic processes or that are directly used in production. They may be:
- natural resource inputs (e.g., mineral and energy resources or timber resources);
- inputs from renewable energy sources (e.g., solar energy captured by economic units);
- other natural inputs such as inputs from the soil (e.g., soil nutrients) and inputs from the air (e.g., oxygen absorbed in combustion processes).
In the extraction of some natural inputs, not all the extraction is retained in the economy (the discarded part of fishing catches, residues from timber felling). The extraction that is not retained in the economy is considered having returned immediately to the environment and is called “natural resource residuals.”
Products are goods and services that result from a process of production in the economy. Generally, the existence of a product is evidenced by a transaction of positive monetary value between two economic units (e.g., the production of a car and its sale by a manufacturer to a purchaser). For accounting purposes, only flows of products between economic units are recorded and flows internal to the operation of an establishment are ignored. However, in analyzing flows of energy it may be relevant to record the energy generated by an establishment when it burns its own solid waste.
Residuals (often suitably described as “waste”) are flows of solid, liquid or gaseous materials and energy that are discarded, discharged or emitted to the environment (e.g., emissions to the atmosphere) by establishments and households through processes of production, consumption or accumulation. Residuals can also flow within the economy as is the case when, e.g., solid waste is collected as part of a waste collection scheme.
Physical flows are divided into three categories (subsystems): energy, water and materials. Materials themselves are often analyzed by the type of material or specific group of materials, e.g., flows of solid waste or carbon emissions. Physical flows are recorded in asset accounts where they represent changes in the stocks of assets between one period and another. Depletion is an important flow in physical terms characterizing the state of environmental assets. It occurs when natural resources are used up through their extraction, collection and harvesting by economic units, leading to reduced availability of the resources in the future if current extraction rates are maintained. A distinction must be made between renewable and non-renewable resources.
Flows in monetary terms are recorded in the form of transactions and as other flows. A transaction is an economic flow, which is an interaction between economic units based on mutual agreement (sale of timber products, purchase of environmental protection services). Other flows related to changes in the value of assets and liabilities that do not result from transactions include: new discoveries of assets or losses of assets due to natural disasters and the effect of price changes on the value of assets and liabilities.
In physical terms, stocks are the total quantity of assets at a given point in time (tons of coal, cubic meters of timber, hectares of land). Individual environmental assets include mineral and energy resources, land, soil resources, timber resources, water bioresources, other biological resources and water resources. These assets are defined by their material content (e.g., the volume of timber or soil resources) without specific reference to their constituent elements (e.g., the carbon in timber and nutrients in soil resources). A distinction is made between produced (cultivated) and non-produced environmental resources. It is accepted that the volume of water in oceans is not considered because this stock of water is too large. This does not in any way limit the measurement of ocean-related individual assets such as aquatic bioresources or mineral and energy resources on the ocean floor. On the whole the scope of measurement for each environmental asset includes all stocks that may provide benefits to humanity.
The measurement of stocks in monetary terms focuses on the value of individual environmental assets and on changes in those values over time. The valuation of these assets focuses on the benefits that accrue to economic owners of environmental assets. Not all the benefits that may accrue to current and future generations are given a monetary value in order to provide what might be regarded as a social valuation of environmental assets. There may be some stocks recorded in physical terms that have zero economic value: all the land in a country is included in the scope of a full analysis of changes in land use and land cover, but some land may be considered having zero value in monetary terms.
It is recommended to use market values for the valuation of environmental assets. However, in the case of many environmental assets, there are only a few markets that buy and sell them in their natural state; so determining an asset’s economic value can be difficult. A number of approaches to estimating market prices are possible if there are no observable market prices (these issues are discussed in more detail in Chapter 1.4)
1.3.2.1 Supply and Use Tables (residual accounts)
Most of the indicators in supply and use tables represent the basis for compiling environmental asset accounts and are presented in the next subsection. Therefore, only those modules are given below, which refer to physical flows of residuals between the economy and the environment Residual accounts are formed in accordance with the structure of the physical supply and use table and include accounts of atmospheric emissions, emissions to water bodies and solid waste.
The atmospheric emission account (Table 1.9) records emissions from economic units by types of substance.
Table 1.9 Atmospheric emissions account (tons)
Supply table for atmospheric emissions Use table for atmospheric emissions
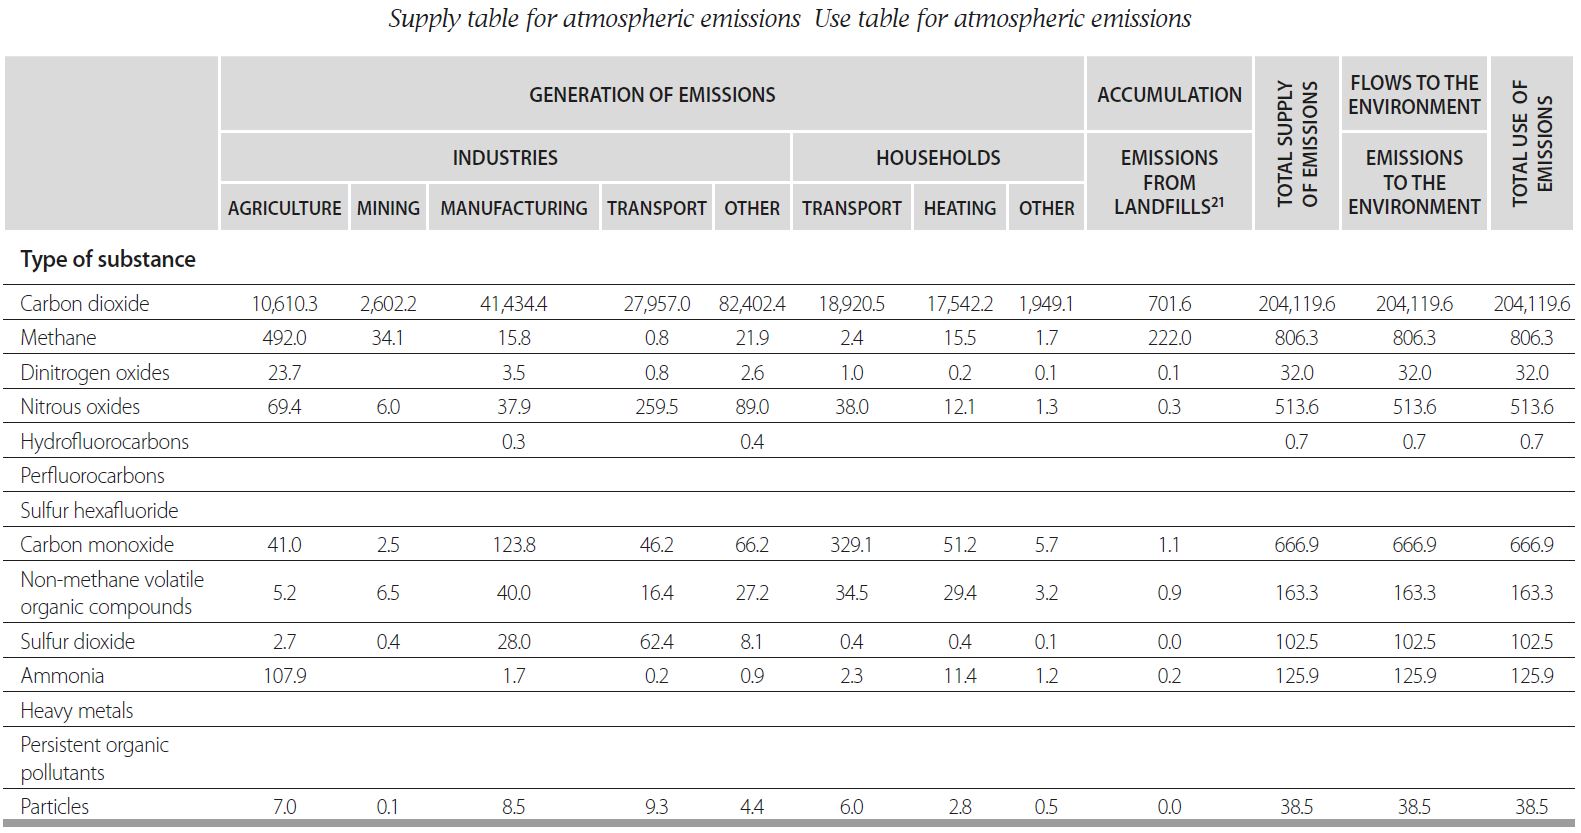
Source: UN, 2012a, p. 88.
The left-hand part of the table shows the generation of emissions from industries and households by types of substance. For accounting of carbon dioxide emissions it is recommended, where possible, that carbon dioxide emissions from the burning of fossil fuels should be distinguished from carbon dioxide emissions from biomass. The column for accumulation shows the release of atmospheric emissions from controlled landfill sites, since they reflect the release of emissions from production, consumption and accumulation in earlier periods. These emissions should be attributed to the waste management units that operate the landfill sites.
Atmospheric emissions by households are broken down by purpose (transport, heating, other). Additional purposes can be added depending on analytical requirements and available information.
The right-hand part of the table presents the use table for emissions to the atmosphere. Atmospheric emission accounts for a particular country exclude emissions released within a national territory by non-residents (e.g., tourists or foreign transportation operations), whereas the emissions abroad of resident economic units are included. Atmospheric emission accounts do not record capture or absorption of gases by the environment (e.g., carbon captured in forests and soil). Emissions from natural processes such as unintended forest and grassland fires are not included.
Atmospheric emissions generated by industries and households are measured at the point of release, i.e., after they have passed through any relevant filtering or emission-reduction technology or process within the relevant establishment. The physical flows of emissions should be classified using the same classifications used in the SNA in order to permit effective linking of physical flow data to monetary data.
Water discharge accounts Emissions of substances to water resources and sewerage systems are accounted in the SEEA framework (Fig. 1.6).
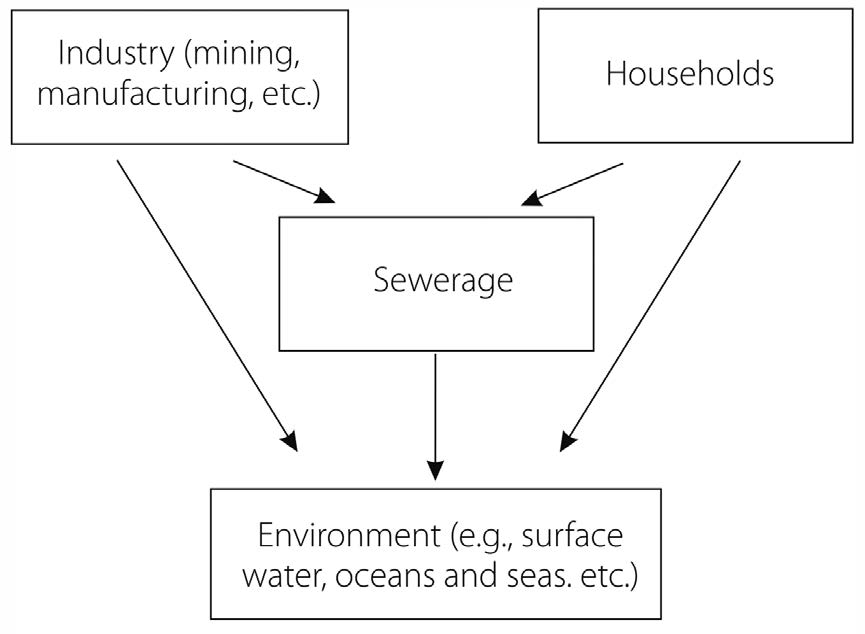
Fig. 1.6 Water discharge accounts
Water discharge accounts provide information about economic units releasing wastewater, types and amounts of substances, and points of release. Water discharge accounts are an efficient tool for developing economic instruments, including new regulatory standards to reduce the amount of emissions to inland water bodies, seas and oceans. When examined in conjunction with existing technologies, the data in the accounts can be used to estimate the efficiency of available technologies for the reduction of pollutants in water.
Water discharge accounts record the amount of substances added to water by industries and households over an accounting period. This amount is measured in kilograms or tons. Thus, water discharge accounts provide a description of the wastewater flows included in the physical supply and use table from the point of view of substances generated in the course of economic activity.
Sources of water discharges are classified as point sources and non-point sources. Point-source water discharges are those for which geographical location of the discharge of the wastewater is clearly identified, e.g. water discharges and releases from sewerage facilities, power plants and other industrial establishments. Non-point (or diffuse) sources of water discharge and releases are sources without a single point of origin or a specific outlet into the receiving water body. Water discharges from non-point sources include substances carried off the land by urban run-off and releases of substances that result from a collection of individual and small-scale activities which, for practical reasons, cannot be treated as point sources.
The SEEA account for water discharges (Table 1.10) is a reduced version of the general Physical Supply and Use Table format.
Table 1.10 Water discharge accounts
Physical supply table for gross releases of substances to water
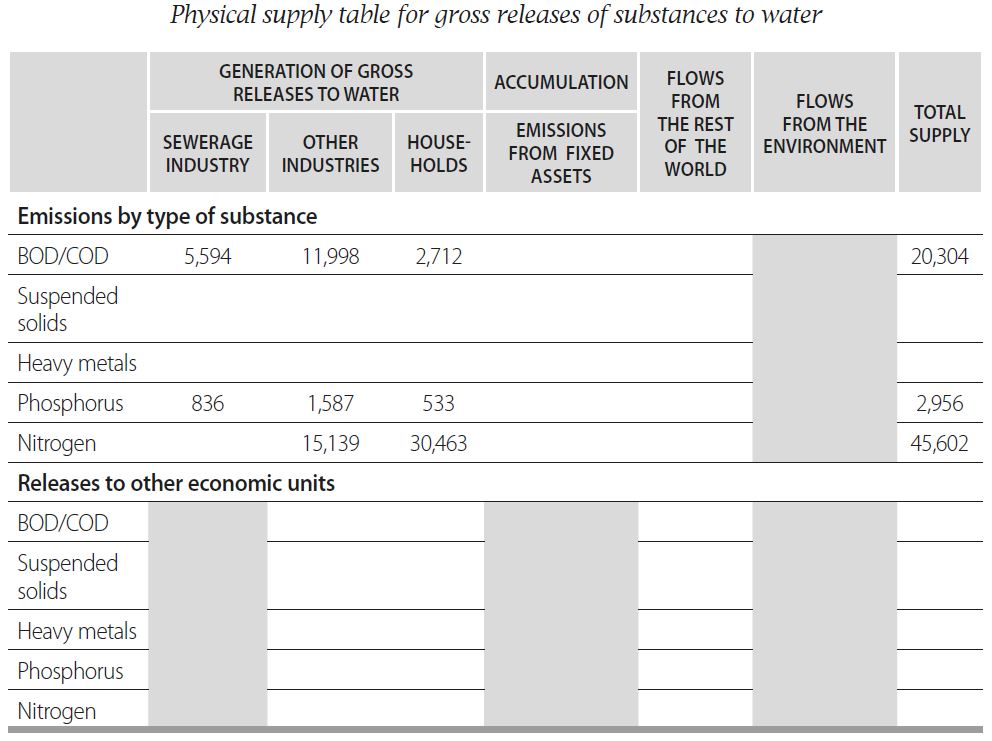
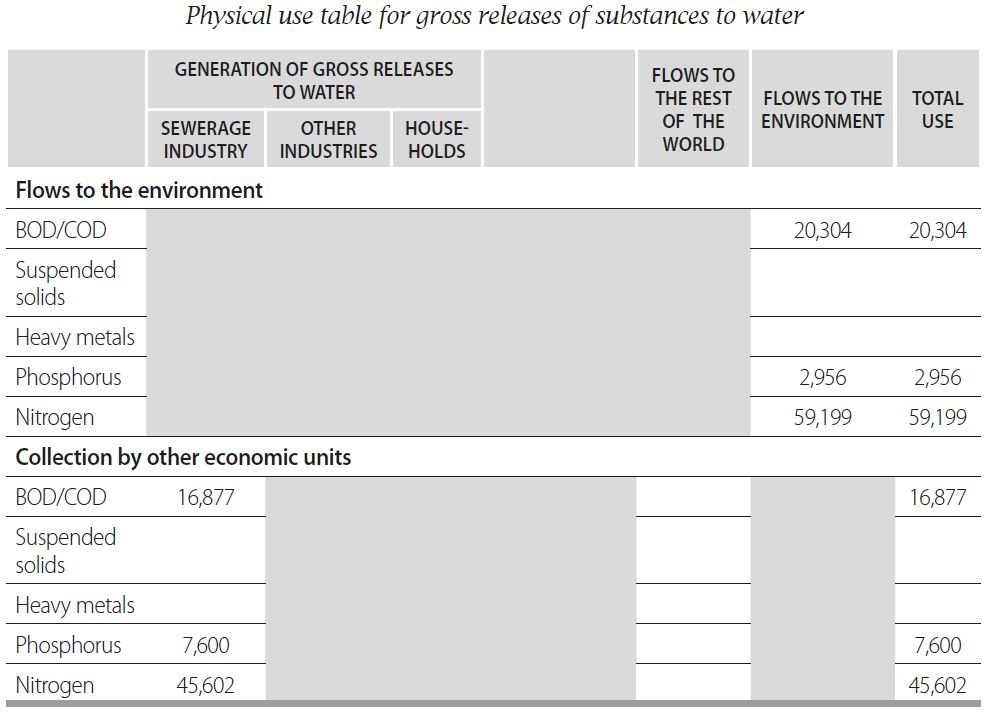
Note: Dark gray cells are null by definition.
Source: UN, 2012a, p. 93.
The top half of the table (the supply table) shows the generation of water discharges and leakages with a breakdown by industries and households and by type of substance, showing treatment of releases by sewerage systems. The bottom half of the table (the use table) shows releases of wastewater for treatment by sewerage services and releases to the environment. The level of industry detail in the table is dependent on data availability and analytical needs. Where the focus is on a particular type of substance, the rows of the table may be structured to reflect the destinations of discharges. Thus, for any particular industry or household, it is possible to show the quantity of emissions that flow directly to the environment and releases that flow to sewerage facilities. The environment column may also be disaggregated to show releases to inland water bodies or to the sea.
The exchange of relevant substances with the rest of the world (imports and exports) covers the exchanges of substances associated with the release of wastewater from one country to a sewerage facility in another country. Water discharge accounts do not include “imports” and “exports” of substances through natural flows of water resources. So the quantity of respective substances in rivers crossing national borders and/or flowing to the open sea is not recorded in the water discharge accounts.
These accounts do include discharges of relevant substances from capital goods (such as vessels operating on a country’s waterways) due, for example, to corrosion or fuel leaks. These flows are recorded in the accumulation column. Finally, discharges due to activities undertaken in water bodies or seas (e.g., dredging of waterways and ports) are included and recorded against the relevant industry.
Solid waste accounts are useful when organizing information on the generation of solid waste and the management of flows of solid waste to recycling facilities, to controlled landfills or directly to the environment. The construction of solid waste accounts allows these indicators being placed in a broader context with economic data in both physical and monetary terms. Discarded materials sold as used products, for example, a second-hand car or furniture, should be treated as flows of products and not as solid waste.
In practice, in many countries statistics on solid waste are based on legally regulated administrative lists of materials deemed to be solid waste. The structure of solid waste accounts (Table 1.11) follows the logic of the general Physical Supply and Use Table. For illustration, the table includes an indicative listing of types of solid waste based on the statistical version of the European Waste Catalogue (EWC-Stat)30 .
Table 1.11 Solid waste account (tons)
Physical supply table for solid waste
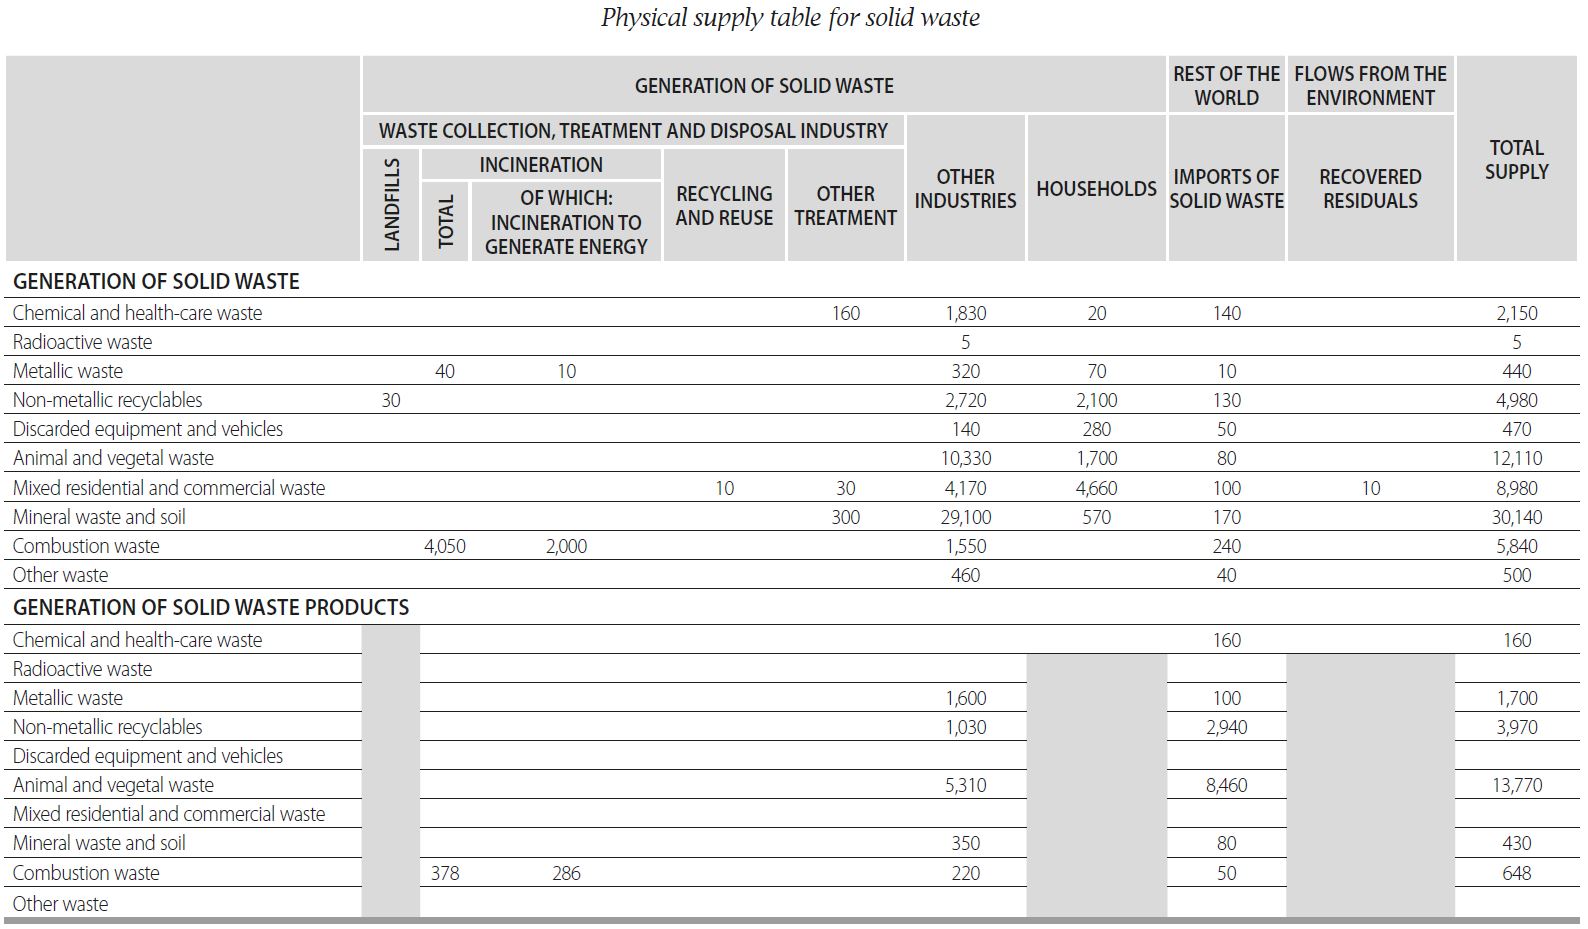
Note: Dark gray cells are null by definition.
Physical use table for solid waste
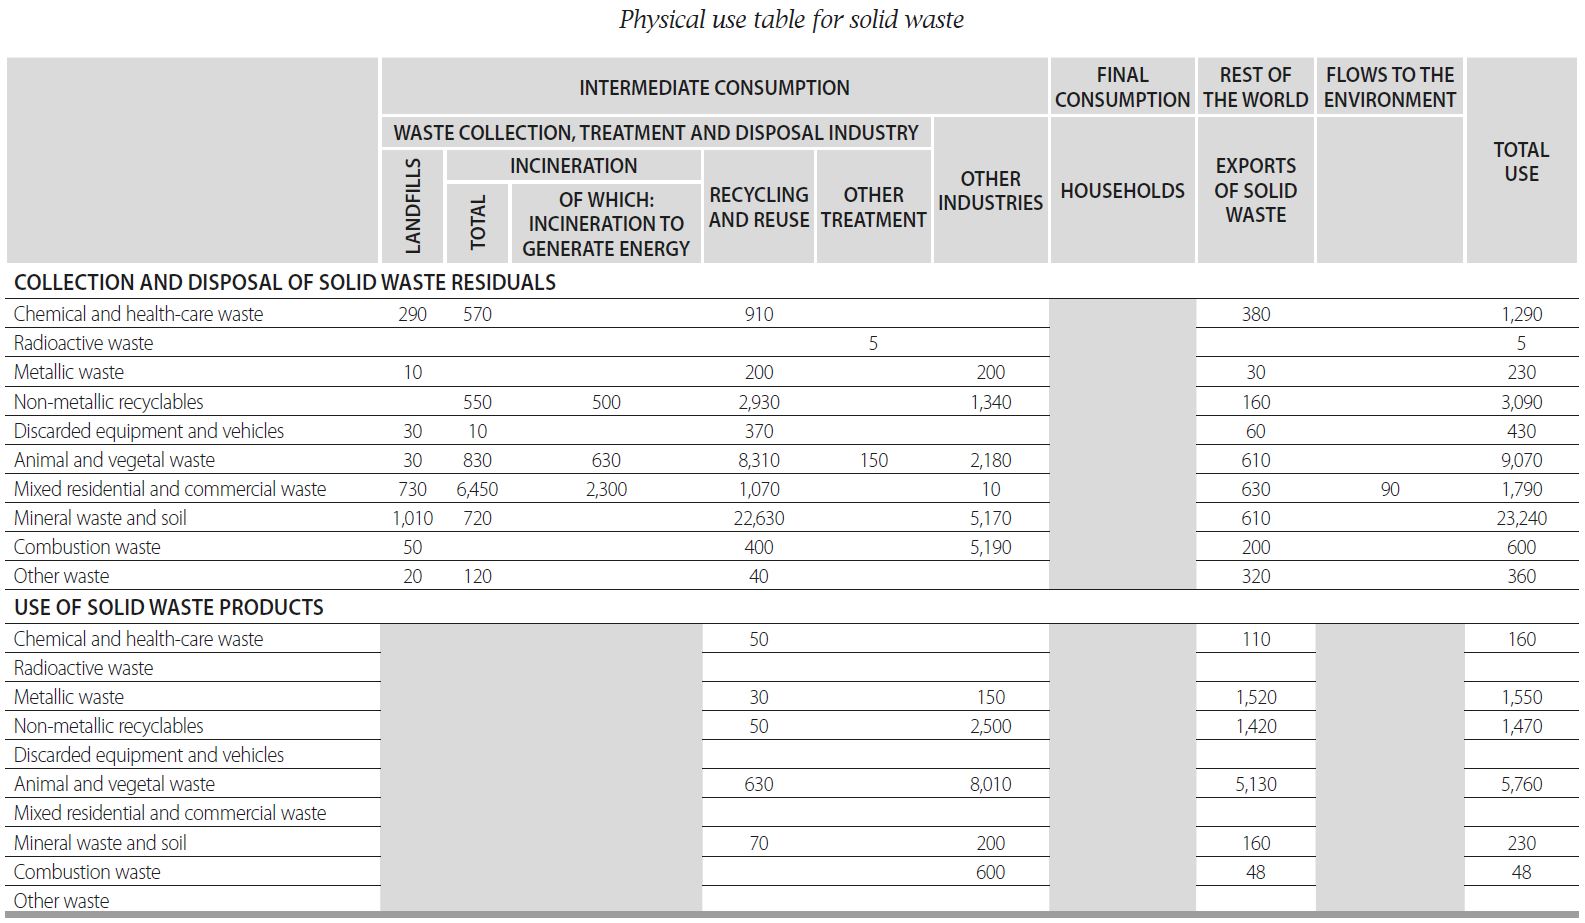
Note: Dark gray cells are null by definition.
Source: UN, 2012a, p. 96-97.
The upper half of the table is the supply table, the first part of which (“Generation of solid waste residuals”) shows the generation of solid waste with a breakdown by industries and households. It also shows the supply of solid waste from the rest of the world (recorded as imports) as well as solid waste recovered from the environment (e.g., oil recovered following an offshore oil spill, debris collected following a natural disaster, or excavation of soil from locations where hazardous chemicals were used).
The bottom part of the table is the use table, the first part of which (“Collection and disposal of solid waste residuals”) shows the collection and disposal of solid waste through various activities included in the waste collection, treatment and disposal industry and through related activities in other industries. It also shows the flow of solid waste to the rest of the world as exports and the flow of solid waste direct to the environment.
The columns of the table highlight various activities in the waste collection, treatment and disposal industry: landfill operations, incineration of solid waste, recycling and reuse activities and other treatment of solid waste (e.g., use in physical-chemical processes, mechanical-biological processes, and the storage of radioactive waste). More industry detail can be provided depending on analytical requirements and available information. Accumulation of waste in landfill sites is not presented in a distinct accumulation column as in the general Physical Supply and Use Table. This is because it is desirable to present all information on the waste collection, treatment and disposal industry as a single group.
The second part of the supply table (“Generation of solid waste products”) and the second part of the use table (“Use of solid waste products”) record flows of solid waste that are considered being products rather than residuals. The flows recorded here relate to instances where a solid waste product is identified at the time of disposal by the discarding unit. The flow is recorded in the second part of the supply table and is matched by use of solid waste products in the second part of the use table. Sales of scrap metal are recorded in this way. Sales of products manufactured from solid waste or simply obtained from waste collection are not included in this table.
1.3.2.2. Asset accounts
The general methodological approaches and techniques for summarizing data and deriving indicators on the state and changes in stocks and use of environmental resources in the economy, described in the Central Framework of SEEA 2012, have specific features for different environmental assets: water resources, mineral and energy resource and non-cultivated biological resources (forest and animal resources).
Water resources
The main elements of the SEEA for water resources are monetary estimates, a compilation of asset accounts and inclusion of the respective estimates in the standard calculation of basic macroeconomic indicators at national and regional levels. Formation of these elements is based on various tables, primarily physical supply and use tables. These tables provide the basis for subsequent compilation and modification of asset accounts.
Physical supply and use tables for water resources
The inland water system includes surface water (rivers, lakes, artificial reservoirs, glaciers, etc.), ground water and water in soil within a specific territory.
Surface water comprises all water that flows over or is stored on the Earth’s surface. Instances of surface water include: artificial reservoirs (purpose-built reservoirs used for storage, regulation and control of water resources); lakes (large bodies of standing water occupying a depression in the earth’s surface); rivers and streams (bodies of water flowing continuously or periodically in channels); snow and ice (including permanent and seasonal layers of snow and ice on the surface of the Earth); and glaciers (accumulations of snow of atmospheric origin, generally moving slowly on land over a long period). Overland flows, i.e., flows of water over the ground before entering a channel (or a reservoir), are also part of surface water but the stock of these flows at any time is small and hence not separately recorded.
Groundwater is water that collects in porous layers of underground formations known as aquifers. An aquifer is a geological formation, a group of formations, or part of a formation that contains sufficient saturated permeable material to yield significant quantities of water to wells and springs. An aquifer may be unconfined, i.e., having a water table and an unsaturated zone, or may be confined when it is between two layers of impervious or almost impervious formations.
Soil water consists of water suspended in the uppermost belt of soil, or in the zone of aeration near the ground surface. This water can be discharged into the atmosphere by evapotranspiration (the process whereby a quantity of water is transferred from the soil to the atmosphere by evaporation and plant transpiration), absorbed by plants, flow to groundwater or flow to rivers (run-off). Some part of transpiration and absorption of water by plants is used in production (e.g., the growing of crops).
All flows related to inland water are recorded in asset accounts for water, including flows from adjacent seas and oceans and flows to those seas and oceans (run-off). The Physical Supply and Use Table for water includes: uptake of water from inland water system and from seas and oceans by various economic units; supply and use of this water by different economic units; and return discharge of wastewater to the inland water system and to seas and oceans. Flows such as evaporation from lakes and artificial reservoirs and flows (cross-flows) between water bodies are considered being flows inside the environment and are only recorded in asset accounts. Waste discharge to water bodies is accounted in a separate table.
A typical supply and use table for water contains information about water supply and use and covers all water flows (Table 1.12).
Table 1.12 Physical supply and use table for water (illustrative example, m3)


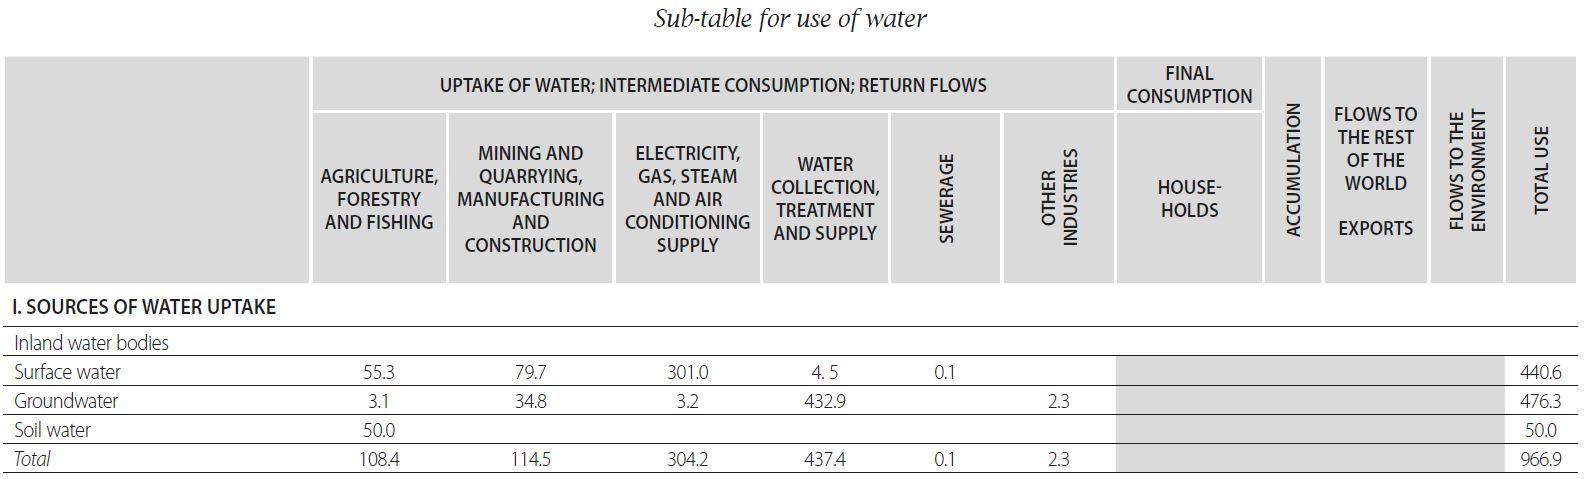

Note. Dark gray cells are null (no observable phenomena)
Source: UN, 2012a, p. 79-80.
The Physical Supply and Use Table comprises five sections which organize information on: uptake of water from the environment; distribution and use of water uptake across enterprises and households; flows of wastewater and reused water (between households and enterprises); return flows of water to the environment (discharged wastewater); water losses in the form of evaporation and transpiration during these uses and during incorporation of water into products. Table 1.12 is divided into two parts: supply table and use table.
Section I of the supply table “Sources of water uptake” shows uptake of water from the environment. The same volume of water is recorded in Section I of the use table “Sources of water uptake” by industries that carry out the uptake. Water may be taken from artificial reservoirs, rivers, lakes, groundwater and soil water The capture of precipitation, e.g., the capture of water from the roofs of houses in water tanks, is recorded as precipitation, However, precipitation direct to the inland water system is not recorded in the Physical Supply and Use Table, but in the asset account for water.
Water used for hydroelectric power generation is considered as uptake and is recorded as use of water by the party, which carries out such uptake. Water, which is taken but is not used in production (e.g., water obtained during dewatering of mines), is recorded as natural resource residuals. Water uptake is disaggregated by source and by industry.
Following the general treatment of household own-account activity, the uptake of water by households for own consumption should be recorded as part of the activity of the water collection, treatment and supply industry. In addition, there may a range of different modes of water supply; e.g., water supply to agricultural enterprises. Such a supply mode may be carried out quite differently from water supply to urban areas. Accordingly, additional columns may be included in the supply table in order to highlight different types of water uptake in the general category of water supply.
To record water supply consistently with the treatment of the asset accounts for water resources, water in artificial water bodies (e.g., reservoirs) is not considered having been produced. In other words, these resources are not considered having come into existence via a process of production. Consequently, uptake of water from artificial reservoirs is recorded as uptake from the environment. Flows of precipitation into artificial reservoirs and flows of evaporation from the reservoirs are not recorded in the Physical Supply and Use Table for water resources. As mentioned above, these flows are recorded in asset accounts for water resources as a part of the general system of macro-accounting for the change of the stock of water over an accounting period.
Uptake of soil water refers to the absorption of water by plants. It is equal to the amount of water transpired by plants plus the amount of water that is contained in the harvested product31 . Most of soil water uptake is used in agricultural production and in cultivated timber resources. In theory, such use includes all soil water, which is taken up for use in production32 . According to the SEEA 2012, the amount of soil water, which is taken up, can be calculated on the basis of data about areas under cultivation using coefficients of water use. Different coefficients should be used for different crops. Other relevant factors should also be taken into consideration (e.g., soil types, geography and climate) (UN, 2014).
Water that has been taken up must either be used by the same economic units that take it (i.e., take water for their own use) or distributed (possibly after treatment) to other economic units for other applications. Most of the water for such distribution is recorded under ISIC classification as “Water collection, treatment and supply” However, there may be other industries that take and distribute water as their secondary activity.
Part II of the supply sub-table entitled “Water uptake” shows the uptake of water by industries, differentiating between water taken for own use and for distribution. This part of the supply sub-table also records imports of water from the rest of the world. The use of this water is shown in part II of the use sub-table. In this part, the water available for use is recorded under intermediate consumption of respective industries and final consumption of households or exports to economic units in the rest of the world.
Within the economy, water is often exchanged between water distributors before being delivered to specific (final) users. These water exchanges are referred to as intra-industry sales. An example is a situation where the distribution network of one distributor does not reach the water user, so that water must be sold to another distributor whose network reaches the said user and who can provide the required volumes of water to the user. In principle, all intra-industry sales must be recorded according to standard accounting principles. However, these transactions are not recorded in the Physical Supply and Use Table, as this would unreasonably increase the total flows recorded (i.e., considerable repeat accounting may occur). So intra-industry sales are internal transactions, i.e., economic transactions with water resources in situ, i.e., the same physical flow of water occurs whether intra-industry sales take place or not. Meanwhile, depending on the volumes of water involved in distribution, sales and purchases, it may be useful to present these internal transactions (intra- and inter-industry flows) in a supplementary table.
After statistical accounting for the distribution and use of water, flows of wastewater and effluents between economic units have to be considered. Wastewater is discarded water, which is no longer required by the owner or user. Wastewater can be discarded directly into the environment (in which case it is recorded as a return flow), supplied to a sewerage facility (recorded as wastewater to sewerage) or supplied to another economic unit for further use (recorded as reused water). Flows of wastewater can in principle include exchanges of wastewater between sewerage facilities in different economies, i.e., transfer of wastewater from sewerage systems of one country to similar systems of another country. These flows are recorded as imports or exports of wastewater.33
Part III of the supply sub-table, “Wastewater and reused water,” records wastewater flows to a treatment facility or supplied to another economic unit; the same flows are recorded in the respective section of the use sub-table. Flows of wastewater are generally residual flows between economic units, since the flow of wastewater to a sewerage facility is generally accompanied by the payment of a service fee to the sewerage facility. In other words, sewerage facilities do not purchase wastewater discarded by an economic unit but rather provide paid services in wastewater disposal and treatment.
Reused water is wastewater supplied to a user for further use with or without prior treatment. This does not include the reuse (or recycling) of water within economic units themselves. Such reuse often occurs with wastewater from reclamation systems. Reused water is considered being a product when payment is made by the receiving unit. Once wastewater is discharged into the environment (e.g., into a river), its re-uptake downstream is not considered being reuse of the water in the accounting sub-tables, but rather as a new uptake from the environment.
Part IV of the supply table, “Return flows of water,” records all water that is returned to the environment as supplies to the environment. In some cases, these flows will comprise flows of wastewater direct to the environment from industries and households. In other cases, these flows will comprise flows of water from treatment facilities following treatment. In the supply sub-table, such flows are shown as being supplied by the various industries and households either to the inland water system or to other sources, including the sea. Corresponding volumes of water are recorded in part IV of the use sub-table as flows received by the environment.
Some return flows of water to the environment are losses of water resources. Such losses include flows of water that do not reach their intended destination or are lost (through evaporation, etc.) from storage. Losses during distribution occur between a point of uptake and a point of use or between points of use and reuse of water. These losses may be caused, e.g., by evaporation (when water is distributed through open channels) and leakages (when water leaks from pipes or from distribution channels during filtration). In practice, when losses during distribution are computed as a difference between the amount of water supplied and the amount received, problems may arise associated with accuracy in the measurement and evaluation of these volumes. The reasons for this may include difficulties and accounting inconsistencies during water reception and transfer as well as illegal uptake of water and other factors.
Urban run-off from surface water channels is that portion of precipitation on urban areas that does not naturally evaporate or sink into the ground. These volumes, as a rule, flow into overland flows, i.e., into water sources. That is to say, they are transported via pipes to a defined point of surface water channels or a constructed filtration facility (e.g., filtration fields). Urban run-off that is collected by sewerage (storm-water drainage) or similar facilities is recorded as uptake of water from the environment (and, according to ISIC classification, is ascribed to the sewerage industry). The respective run-offs may then be treated before their return to the environment or may be treated and distributed as reused water. Urban run-off that is not collected by a sewerage system but flows directly to the inland water system is not recorded in the Physical Supply and Use Table.
To fully account for the balance of flows of water entering an economy through uptake and returning to the environment as return flows of water, three additional physical flows need to be recorded: evaporation of water uptake, transpiration and water incorporated into products.
Flows of evaporation are recorded when water is distributed between economic units after uptake, for instance, during distribution via open channels or while accumulating (collecting and storing) in open facilities and in various water storage tanks and reservoirs. The transpiration of water occurs when soil water is absorbed by cultivated plants as they grow and is subsequently released into the atmosphere in the course of physiological processes taking place during vegetation. Amounts of water directly incorporated into products (e.g., water used in the manufacture of beverages) are shown as being supplied by the relevant industry, which is generally a manufacturing industry.
The supply and use of water uptake that evaporates, is used in transpiration and is incorporated into products is recorded in Part V of the supply and use table.34
The results of the above macro-accounting of water resources provide a useful tool for improved water management. The relevant data can be coordinated with macroeconomic accounts in order to measure the intensity and productivity of water use. Generally, the SEEA envisages three main water aggregates that can be obtained on the basis of Physical Supply and Use Table data.
1. Gross Water Input. This indicator reflects the total water that is taken up from the environment or imported. It characterizes the pressures placed on the environment of a specific country (or the environment of other countries) through the supply of water to the economy. Thus, in the Physical Supply and Use Table for water the said gross input is equal to the total water uptake plus imports of water resources. For analytical purposes, it may be useful to disaggregate gross water input by source (e.g., surface water, groundwater, soil water or other sources). Gross water input can also be grouped by types of economic activity.
2. Net Domestic Water Use. This indicator focuses on accounting of the use of water by resident economic units. This aggregate excludes all flows of water between economic units (and hence is a net measure) and also deducts all exports of water. So the indicator is defined as the sum of all return flows of water to the environment plus evaporation, transpiration and water directly incorporated into products. Net domestic water use can be presented as the sum of data on different industries and households. Where exports and imports of water are relatively small, there will be little difference between gross water input and net domestic water use at a national level. However, this difference may be of interest in compiling the aggregates at an industry level, e.g., for agriculture, or for water collection, treatment and distribution of water. In the same way, this difference may be important in analyzing water use at a regional level, since water “imports” and “exports” in different regions of a country may be significant
3. Final Water Use is generally referred to in macro statistics as water consumption.35 This aggregate is a key indicator of environmental pressure (i.e., scale and impact) with respect to water. This is explained by the fact that a large proportion of the water uptake is returned to the environment and may therefore be taken up once more. So the amount of final water use is equal to evaporation and transpiration plus water incorporated into products. That is to say, this aggregate shows the quantity of water uptake, which is no longer available for use.36
The above-mentioned aggregates and indicators based on the Physical Supply and Use Table do not cover all flows, kinds and forms of changes in water stock in inland water resources. They do not include, e.g., losses of water due to evaporation from artificial reservoirs. As mentioned above, these losses are recorded in the asset accounts for water resources.
Asset accounts for water resources in monetary terms.
Measuring water stock in monetary terms is particularly difficult. The main problem is that, historically, water has often been made available free of charge as a public good supplied below the cost of production in order to support agricultural production or supplied at a flat charge because it has been perceived that water cannot be subject to scarcity. The monetary prices, therefore, have tended to be related to the fixed infrastructure costs of collecting and transporting water to specific destinations rather than to the actual volume of water used, which may vary significantly.
Given this situation, the standard approaches to valuation of water assets, and in particular the net present value approach, are not appropriate because the resource rent that is derived following standard definitions is negative. Estimates of negative resource rent arise when the income earned from the sale of water uptake does not cover the costs of maintaining the produced assets required to distribute the water. Consequently, the value of the water resources themselves is considered being zero.
There is a trend towards water pricing that reflects the full costs of managing, uptake and distribution of water resources. Consequently, there may be some instances where such approaches as net present value (NPV) are applicable37 . In these cases, these values should be incorporated as part of the overall monetary value of environmental assets and a part of the value of economic assets.
Use of water to generate hydropower is a specific case where there is potential for applying NPV approaches efficiently for the valuation of water resources. In this case future income streams from water resources (from the sale of energy) can be estimated following the standard NPV approaches. Where such valuation can be made, the resulting asset values should be attributed to water resources.
Another approach to valuation of water resources is to consider the value of water access entitlements, which, in some countries, are traded on a special market. Often, the value of these entitlements is closely connected to the value of the associated land. Determining the relevant proportion of the total value of land that can be attributed to the access entitlements may be a means of determining the value of the associated water. These approaches to valuation are likely to be most relevant in agricultural contexts where access to water by farmers is a significant consideration.
Water statistics can provide data for water management at many geographical levels, ranging from local level and the level of river basins, to national and multinational levels. The choice of a spatial reference for compiling water accounts ultimately depends on the data needed by users and the resources available to data producers. The choice of spatial scale is important, as countries may experience significant geographical variation in the availability of water (e.g., areas of very high or very low rainfall). At the same time, national aggregates cannot accurately reflect the issues facing particular regions.
It is recognized internationally that a river basin is the most appropriate spatial reference for integrated water resource management (see, e.g., Agenda 21 (United Nations, 1993) and the European Water Framework Directive (European Parliament and Council, 2000)). This is because the people and economic activities within a river basin have an impact on the quantity and quality of water in the basin, and conversely the water available in a basin affects the people and economic activities that rely on this water. However, in areas where groundwater is an important water source, aquifers may also be appropriate spatial references for compiling water statistics.
Although data for specific spatial scales within a country are often appropriate for the analysis of water resources, integration of physical data on water at relevant spatial levels, (e.g., river basins) may not align with the available spatial detail for economic data (which is more commonly compiled based on administrative boundaries) In these situations, common areas of observation (accounting catchments) should be defined.
When integrating or collecting water data, it is important that the reference periods for the different data items are aligned. In water and economic statistics, the recommended temporal reference is the calendar year. However, in practice, water and economic data may not be available in a breakdown by calendar years. For example, some countries use a financial year for national accounts, while they may use a hydrological year for water statistics. Financial and hydrological years may coincide with or differ from calendar years. It is also to be noted that in some cases high seasonal variability in the relationship between demand and supply of water may mean that annual data (for either a financial or hydrological year) are insufficient and sub-annual data are required.
Mineral and energy resources
Mineral and energy resources are a unique type of environmental asset in that they can be extracted and used in economic activity but cannot be renewed on any time-scale comparable with human lifetimes. For that reason, there is particular interest in understanding the rate at which these assets are extracted and depleted, the overall availability of these assets and the sustainability of the industries that exploit them.
Asset accounts for mineral and energy resources determine the general structure of the relevant information, including the quantities and values of stocks of the resources and the changes in these stocks over accounting periods. Flows of extraction, depletion and discoveries are central to the asset accounts and these, in turn, can provide valuable information regarding the availability of individual resources.
Valuing stocks and flows of mineral and energy resources allows important links being made to monetary estimates of the value added and operating surplus of the extractive industries, e.g., through the derivation of depletion-adjusted value-added measures. Such measures provide a view of extraction activity that recognizes a more complete set of production costs. Monetary estimates of these assets may also be of interest in the determination of government taxation and royalty settings, given that, in many cases, the government is the collective owner of these assets on behalf of society.
Mineral and energy resources comprise known deposits of crude oil resources, natural gas resources, coal and peat resources, non-metallic and metallic minerals. Since the resources are usually found underground (hence commonly referred to as subsoil assets), the quantity of resources that one might reasonably expect to be extracted is not known with any large degree of precision. Consequently, a key factor in the measurement of mineral and energy resources is the concentration and quality of the minerals and energy resources in the deposit, since this will influence the likelihood and the cost of extraction and the degree of confidence regarding the quantity that can be extracted in the future.
The framework used to define the scope of known deposits is the United Nations Framework Classification for Fossil Energy and Mineral Reserves and Resources 2009 (UNFC-2009) (United Nations, Economic Commission for Europe, 2010), which is a generic, flexible scheme for classifying and evaluating quantities of fossil energy and mineral resources.
Many countries have their own national classification systems based on, e.g., systems developed by the Society of Petroleum Engineers (SPE, 2007), the Committee for Mineral Reserves International Reporting Standards (CRIRSCO) and the International Atomic Energy Agency/International Energy Agency (IAEA/IEA). It may therefore be necessary to apply conversion rates to facilitate international comparisons.
The UNFC-2009 categorizes mineral and energy resources by determining whether, and to what extent, projects for the extraction and exploration of the resources have been confirmed, developed or planned (Table 1.13). The underlying resources are classified based on the maturity of the projects. UNFC-2009 is based on a breakdown of the resources according to three criteria affecting their extraction:
- economic and social viability (E)
- field project status and feasibility (F)
- geological knowledge (G)
The first criterion (E) designates the extent to which economic and social conditions are favorable for establishing the commercial viability of the project. The second criterion (F) designates the maturity of studies and commitments necessary to implement mining plans or development projects, extending from early exploration efforts before a deposit or accumulation has been confirmed through to a project that is extracting and selling a product. The third criterion (G) designates the level of certainty of geological knowledge and potential recoverability of the respective quantities.
Table 1.13 Categories of mineral and energy resources
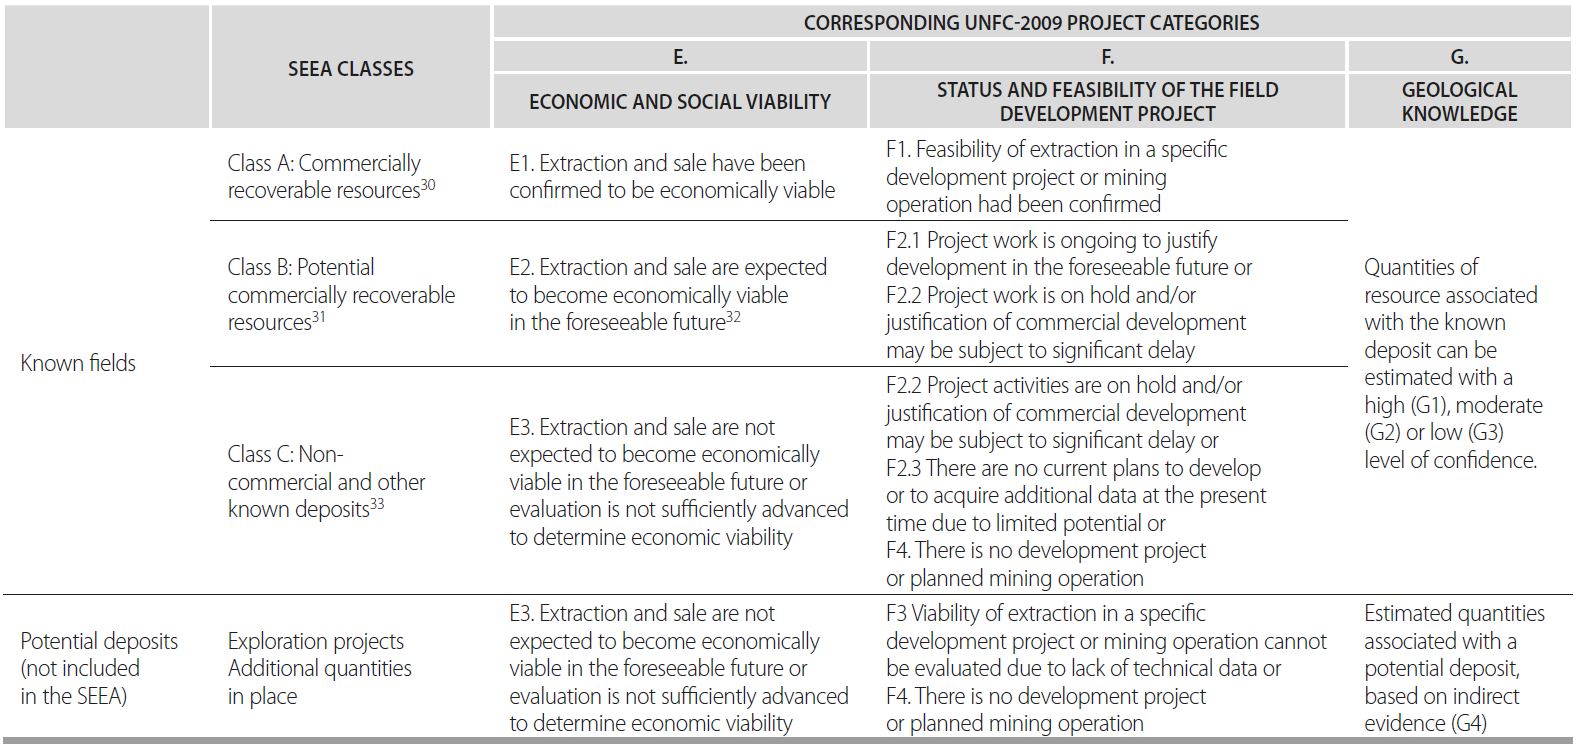
Source: UNFC-2009, diagrams 2 and 3.
Known deposits are categorized in three classes, each defined according to combinations of criteria derived from UNFC-2009.
Class A: Commercially recoverable resources. This class includes deposits for projects in categories E1 and F1 and where the level of confidence regarding geological knowledge is high (G1), moderate (G2) or low (G3).
Class B: Potential commercially recoverable resources. This class includes deposits for projects in categories E2 (or possibly E1) and also in F2.1 or F2.2 and where the level of confidence regarding geological knowledge is high (G1), moderate (G2) or low (G3).
Class C: Non-commercial and other known deposits. These are resources in projects in category E3 and for which feasibility is categorized as F2.2, F2.3 or F4 and where the level of confidence regarding geological knowledge is high (G1), moderate (G2) or low (G3).
Known deposits exclude potential deposits where there is no expectation of the deposits becoming economically viable and the information necessary to determine the feasibility of extraction or provide confidence regarding geological knowledge is not available.42
There is a large variety of different types of mineral and energy resources, including crude oil, natural gas, coal and peat, non-metallic and metallic minerals. However, there is no internationally agreed detailed classification of mineral and energy resources, which would be suitable for statistical purposes.
Physical asset accounts for mineral and energy resources
Physical asset accounts for mineral and energy resources should be compiled by type of resource and should include estimates of the opening and closing stock of mineral and energy resources and changes in the stock over the accounting period.
The measurement units used to compile and present the relevant information can vary by type of resource. They are most likely to be in tons, cubic meters or barrels. For accounting purposes, the same measurement unit should be used, for a single resource, to record the opening and closing stocks and the changes in the stocks over an accounting period.
It should be noted that a total for each class of deposit combining different resource types cannot be meaningfully estimated owing to the use of different measurement units for different resources.43
Ideally, opening and closing stocks of each mineral and energy resource should be classified by classes of resource, i.e., class A: Commercially recoverable resources; class B: Potential commercially recoverable resources; class C: Non-commercial and other known deposits, following the structure in Table 1.14.
Table 1.14 Stock of mineral and energy resources
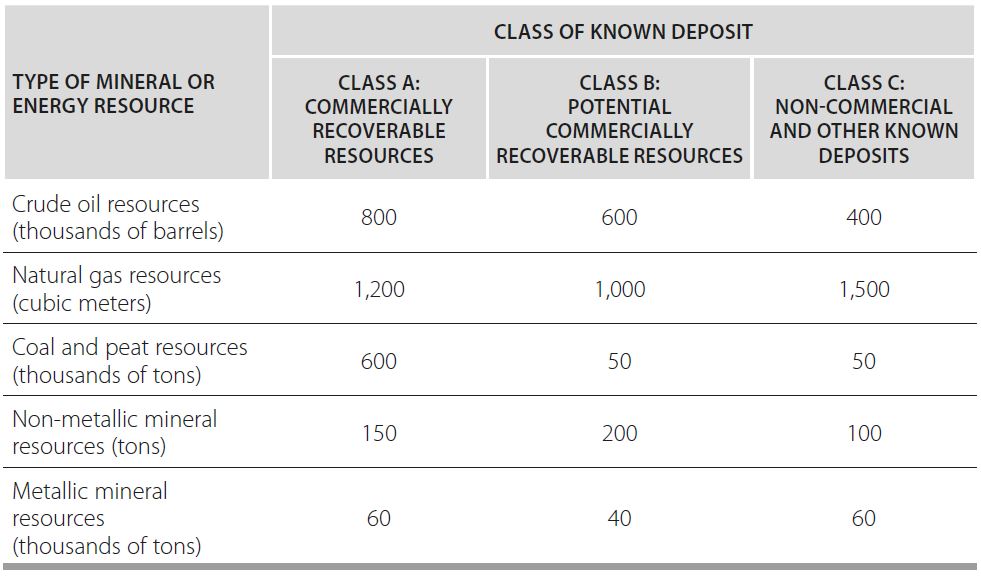
Note: Different physical units (e.g., tons, cubic meters and barrels) are used for different types of resources.
Source: UN, 2012a.
Compiling of totals for all classes of individual resource types is not recommended. Because each class has a different likelihood of extraction, simple summation of the available resources for a specific resource (e.g., coal) may produce a misleading estimate of total available resources.
In this framework, it is important to distinguish those resources, for which a monetary valuation is to be established. If this distinction is not made, a subsequent comparison between physical and monetary accounts for individual resources may provide a misleading indication of average prices and relative availability of individual resources.
The structure of a basic physical asset account for mineral and energy resources is provided in Table 1.15.
Table 1.15 Physical asset account for mineral and energy resources
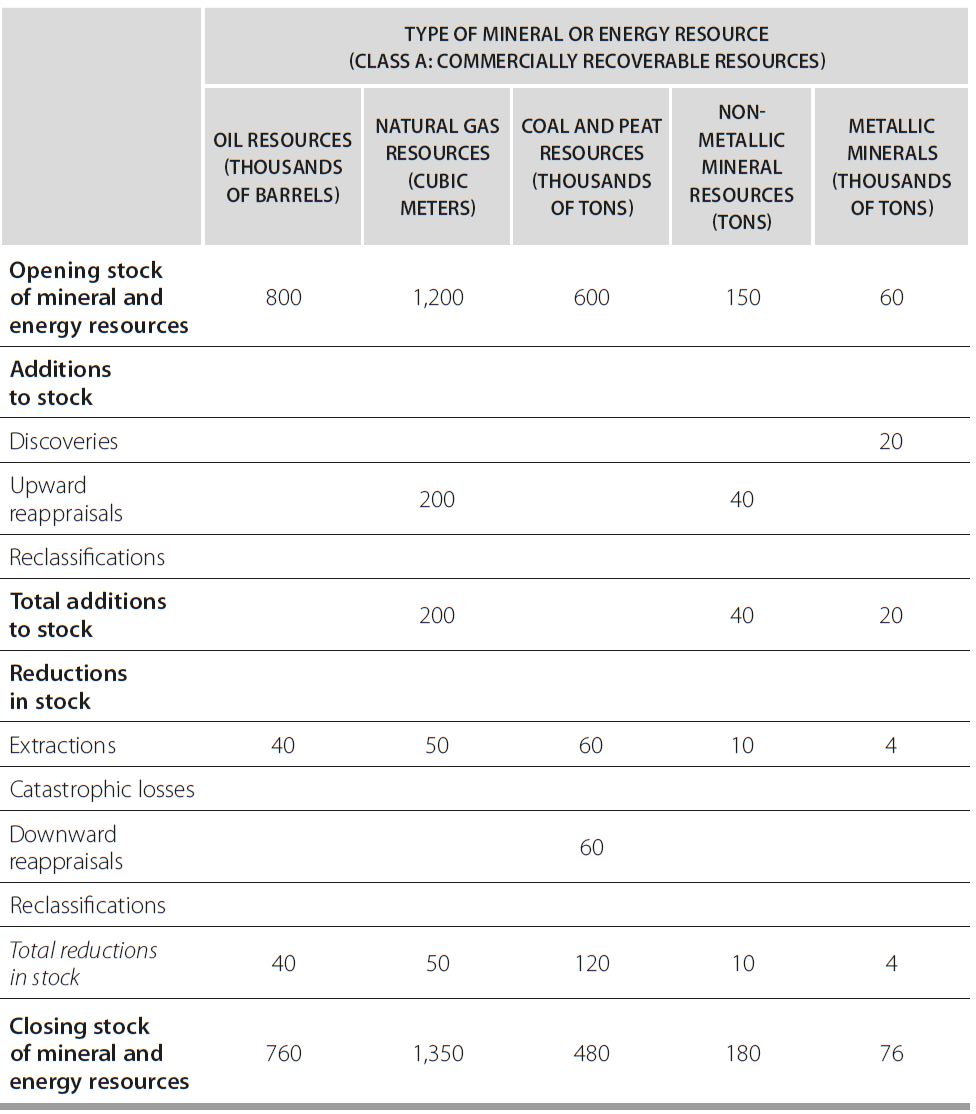
Note: Different physical units (e.g., tons, cubic meters and barrels) are used for different types of resources.
Source: UN, 2012a.
The changes in stock in physical terms should include the following types of changes:
- Discoveries. These include estimates of the quantity of new deposits found during an accounting period. To be recorded as a discovery, the new deposit must be a known deposit, i.e., refer to Class A, B or C. Discoveries should be recorded by type and class of resources.
- Reappraisals may be upward or downward. They should pertain only to known deposits. In general, reappraisals relate to either additions or reductions in the estimated available stock of a specific deposit or to changes in the categorization of specific deposits between Classes A, B or C, based on changes in geological information, technology, resource prices or a combination of these factors.
- Extraction. Estimates of extraction should reflect the quantity of the resources physically removed from the deposit. It should exclude mining overburden, i.e., the quantity of soil and other material moved in order to extract the resource. Further, the quantity of extraction should be estimated before any refining or processing of the resource is undertaken. Estimates of extraction should include estimates of illegal extraction, either by residents or non-residents, as these amounts reduce the availability of the resource. It should be noted that, for the extraction of natural gas, the measurement of the quantity extracted may be more difficult owing to the nature of the extraction process at some deposits. In cases where natural gas is found with crude oil, the oil (and some natural gas) is expelled from the oil well by the pressure, which is exerted by the gas. Some gas that is expelled may be flared rather than put to direct use while another part (especially after extraction has been continuing for some time) may be reinjected to increase the pressure on the remaining oil and thereby allow more oil being extracted. In such cases, if the natural gas associated with the oil is being measured, allowance must be made to reflect the gas, which is reinjected.
- Catastrophic losses are rare. Flooding and collapse may occur, but the deposits continue to exist and can be recovered; the issue is one of economic viability of extraction rather than actual loss of the resource itself. An exception to this general principle concerns oil wells that can be destroyed by fire or become unstable for other reasons, leading to significant losses of oil resources. Losses of oil and related resources in this situation should be considered catastrophic losses.
- Reclassifications may occur if certain deposits are opened or closed to mining operations owing to government decisions concerning access rights to a deposit. All other changes in the quantity of known deposits should be treated as reappraisals. Reclassifications may also be recorded if asset accounts for mineral and energy resources are being compiled by the institutional sector.
Monetary asset accounts for mineral and energy resources
Asset accounts in monetary terms for mineral and energy resources are based on the availability of information on the physical stock of resources. The structure of the monetary asset accounts therefore largely parallels the structure of the physical asset account. The basic structure of such an account is shown in Table 1.16.
Table 1.16 Monetary asset accounts for mineral and energy resources (monetary units)
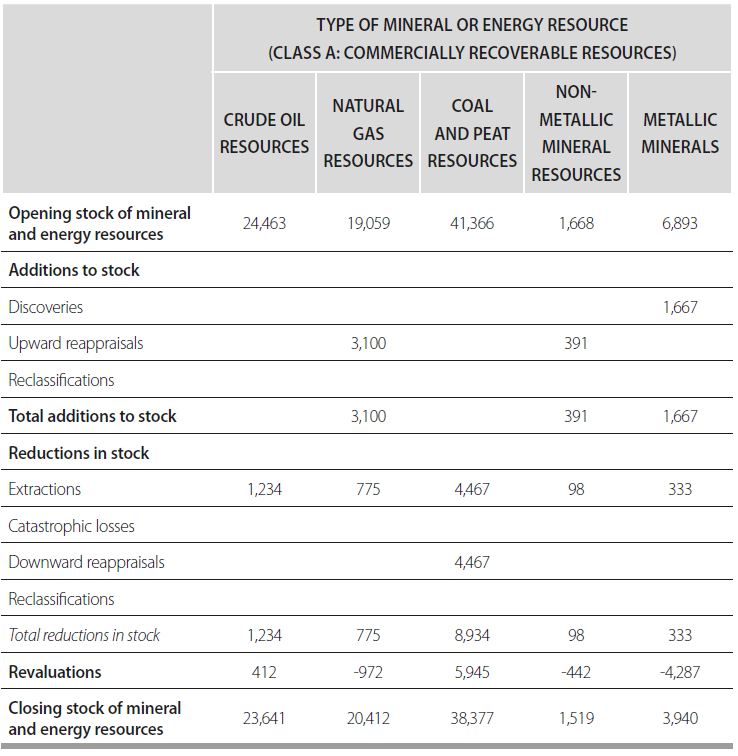
Source: UN, 2012a.
The additional entry in the monetary asset account relates to the recording of revaluations, which occur due to changes in resource prices over the accounting period or due to changes to assumptions underlying the Net Present Value (NPV) approaches that are typically used to value mineral and energy resources.
While the measurement boundary extends to all known deposits in physical terms, it may not be possible to value these deposits in monetary terms owing to degrees of uncertainty regarding expected extraction profiles and incomes. Consequently, the resource rents for deposits in Classes B and C cannot be determined with confidence. It is therefore recommended that valuation be undertaken only for deposits in Class A (commercially recoverable resources). If valuation of deposits in Classes B and C is undertaken, the values for each class should be clearly distinguished. In valuing deposits in each class, it is important that the likelihood and timing of extraction be taken into account in determining expected patterns of extraction and resource rent.
Because transactions with mineral and energy resources in situ are rare, the valuation of these assets requires the use of net present value approaches. The calculations should be undertaken at the level of an individual resource type, ideally for specific deposits of a resource, and then summed over the range of different resources in order to obtain the total value of mineral and energy resources.
Application of NPV approaches in the valuation of mineral and energy resources requires a number of factors to be taken into account, mainly pertaining to the estimation of resource rent.
Estimation of resource rent.In general, the resource rent is estimated based on information about income and operating costs in the extraction industry. The aim is to define a resource rent that is specific to a given resource type, for example, coal. Several factors should be borne in mind for this purpose.
1. Scope of operations. Consistent with the definition of quantities extracted, the scope of the income and operating costs to be considered in the derivation of resource rent should be limited to the extraction process itself and should not include any additional income earned or costs incurred through further refining and processing of the extracted resource. The extraction process is considered including the activity of mineral exploration and evaluation. These costs should be deducted when deriving resource rent.
In some cases, a single deposit may contain several types of resources. For example, an oil well often contains gas; and silver, lead and zinc are frequently extracted together. In these situations, the resource rent used in the calculation of the value of the resources should be allocated by commodity.
However, since data are usually available only for the extracting unit as a whole, the derivation of estimates of resource rent by type of resource based on known extraction costs for each type of resource may not be possible except by using detailed industry knowledge or general rules of thumb to allocate total extraction costs.
2. Price fluctuations. While operating costs for the extraction of resources may not fluctuate significantly, it is likely that income earned from sales of extracted resources will fluctuate. Consequently, the resource rent (which is derived as the difference between income and costs) may entail a highly volatile time series. In addition, the aggregate amount of resource rent in any one period may be affected by extraction rates that in turn may be affected by one-off events, e.g., mine collapse. Since the objective is to define a resource rent that can be forecast, it is recommended: first, that unit resource rents be derived by dividing total resource rent for an individual resource by quantities extracted in a specific period; and, second, that, in the absence of other information on future resource prices, a proxy of unit resource rents (e.g., regression-based estimates and moving averages) may be used as the basis for estimation of future resource rents. To aid interpretation of this information, all assumptions regarding future expected prices and costs should be made clear.
3. Treatment of mineral exploration and evaluation. Mineral exploration is undertaken in order to discover new deposits of minerals and energy resources, which could be commercially exploited. Such exploration may be undertaken by mining enterprises on their own account. Alternatively, specialized enterprises may carry out exploration either for their own purposes or for payment. The information obtained from exploration and evaluation determines subsequent extraction work over a number of years. Hence, these expenditures are considered being one form of gross fixed capital formation serving as the basis for production of intellectual property, which is one type of produced asset.
Mineral exploration and evaluation includes expenditures on exploration for crude oil and natural gas and for non-petroleum deposits and expenditures on subsequent evaluation of the discoveries made.
These expenditures include pre-license and acquisition costs, appraisal costs and costs of actual test drilling and boring, as well as the costs of aerial and other surveys, transportation costs, etc., incurred for purposes of the tests. Re-evaluation may be carried out after commercial exploitation of the resource has begun and the cost of such re-evaluation is also included in the expenditures just mentioned.
Fixed capital consumption should be calculated for a specific asset, using average service lives similar to those used by mining or oil corporations in their own accounts. When estimating resource rent, the user costs of the produced assets are to be deducted, including fixed capital consumption and a return on the produced asset.
It is recognized that the outcome of mineral exploration is the discovery of mineral and energy resources, so the value of mineral and energy resources on the balance sheet may, in part, be considered being due to mineral exploration. However, following the SNA, the output of mineral exploration work is considered being an intellectual property product, not a natural resource. Deduction of the user costs of mineral exploration and evaluation in the derivation of resource rent ensures that the recorded value of the mineral and energy resources reflects only the value of the non-produced environmental resource.
4. Mine and rig decommissioning costs. Consistent with treatment in the 2008 SNA, it is recognized that, in many cases, costs are incurred by extractors at the end of the productive life of a deposit, generally for restoring the natural environment around the extraction site. These costs, where they can be reasonably anticipated or estimated, should be considered reducing the resource rent earned by the extractor over the operating life of the extraction site, even though the actual expenditure is likely to take place at the end of operation of the assets.
5. Aggregation of the same resource over different deposits. In the discussion so far, it has been implicitly assumed that the mineral and energy resources constitute a single deposit, so that any extractions and discoveries affect the resource life of all the resources of a country. In practice this is not the case: some oilfields will be exhausted in a relatively short time frame and extractors will move to other fields.
Many reappraisals apply to established fields where extraction is already in progress. Upward revisions in estimates of stocks extend the life of the resources and the addition to value will reflect the change between the previous and new resource lives since without additional investments the extraction rate is likely to remain steady.
The situation is somewhat different in the case of a completely new discovery. It may happen that a deposit is discovered, which has an expected life of20 years, and contains stocks equal to the country’s existing reserves. It is not realistic to assume that resources in the new deposit will necessarily be extracted in years 21 to 40. Nor is it realistic, on the other hand, to assume that extraction will be completed in years 1 to 20, which would double the total national extraction in these years. It is desirable, therefore, to make projections of the impact of discoveries and reappraisals separately and, ideally, on a deposit-by-deposit basis.
6. Extraction rate. Independently of assumptions about the resource rent, an assumption must be made about the pattern of extraction to be followed in the future. The assumption most often used is that the extraction rate will stay constant in physical terms, but there is no reason why this should necessarily be so. As resources approach extinction, there may be a decline in output if there are no new deposits to take their place. Alternatively, an enterprise could adjust the rate of extraction to give the same total income every year, or reduce the quantity extracted as the resource diminishes, assuming the price increases at the same time. There may be information available from government or from enterprises on projected levels of extraction, which could be used, although such information is often based on conservative projections of the likely level of new discoveries and reappraisals.
In the absence of more precise information, a reasonable assumption is that the rate of extraction is kept constant in physical terms. This amounts to an assumption that the extraction process remains steady and the stock of extraction-related produced assets remains steady in proportion to the available stock of the resource.
7. Resource life. At any point in time, the life of the resource is equal to the stock at that time divided by the expected extraction rate In the course of a year, the resource life will diminish by one year owing to extraction and will change by the quantity of discoveries and reappraisals during the period divided by the average extraction rate.
The quantity of the stock used to calculate the resource life must be consistent with the quantity to be valued. Since only class A resources are to be valued, the resource life must be calculated based only on class A resources and not on total known deposits of the resource (i.e., including also class B and class C resources).
8. Value of discoveries, reappraisals, extractions, depletion and catastrophic losses. The value of additions and reductions in the stock should be calculated using the average prices of the resource in situ over the period multiplied by the quantity discovered, reappraised, extracted, depleted or lost.
9. Acquisitions and disposals of mineral and energy resources. These transactions are likely to be rare, but when they do occur, they should be recorded. Estimates of the value of these transactions should take into account the costs of ownership transfer, which should be recorded as the purchase price of the produced asset. On the balance sheet this produced asset is considered being incorporated into the value of the underlying mineral and energy resources.
Non-cultivated biological resources (forests and animals)
While the vast majority of biological resources are cultivated, there is a range of natural (non-cultivated) biological resources that provide inputs to the economy and form an important part of local biodiversity. These resources include timber, wild berries, mushrooms, fungi, bacteria, fruit, medicinal plants and other plant resources that are harvested for sale or own consumption. They may also include wild animals, such as deer, boar or moose that are killed for sale or own consumption.
Natural biological resources are distinguished from cultivated biological resources because their natural growth and regeneration are not under the direct control, responsibility and management of an institutional unit.
Because they are not under the direct control of institutional units, natural biological resources are not easily accounted for. Aside from natural aquatic and natural timber resources, most animals and plants that provide significant economic benefits are now cultivated. Thus, while there is a wide range of harvested animal and plant resources that are not cultivated, it is typically the case that active measurement is only applied to animals, plants and other biota, for which access rights are controlled (e.g., through hunting licenses) or for which there are other management or conservation arrangements in place. Further, many animals and plants are harvested for own consumption or as part of subsistence farming.
At the same time, in certain countries there are particular species that support quite sizable commercial operations, possibly illegal, and where there is significant extraction of animals and plants from the wild. Examples in this regard include the hunting of elephants for ivory (illegal) and hunting of kangaroos for meat (legal). It may therefore be beneficial to organize data and other information on the quantity and value of the available resources, extraction rates and the possible extent of loss of animal or plant populations due to over-hunting.
We will now examine the structure and logic of accounting of non-cultivated biological resources, as exemplified by the most common cases: timber and animal resources.
Asset accounts for timber resources
Timber resources are important environmental assets for the construction and production of paper, furniture and other products, while also representing a source of fuel and an important carbon sink. The preparation of timber resource asset accounts is one measurement tool that provides information for use in assessing and managing changes in timber resources and the services they provide. For a complete assessment of timber resources it is also useful to construct asset accounts regarding the stock of land associated with timber resources, primarily forest and other wooded land. The changes in the stock of forest and other wooded land due to afforestation and deforestation may be of particular interest.
Timber resources can be found in a wide variety of locations. They may or may not be available to be felled and used as wood supply, i.e., to produce timber products or for fuel. Timber resources may not be available for wood supply due to the fact that the trees are in areas where logging operations are restricted or prohibited, in areas that are inaccessible or remote and where logging is therefore not economically viable, or because they do not belong to a commercially useful species due to biological features of the trees.
While timber resources that are not available for wood supply do not possess an economic value, these timber resources remain in the scope of timber resources in the SEEA in physical terms, as they meet the definition of environmental assets and may provide benefits. However, since these resources do not have an economic value, they are not recorded in the asset accounts for timber resources in monetary terms. Consequently, the volume of these timber resources in physical terms should be clearly identified so that appropriate alignment can occur between asset accounts in physical terms and monetary terms.
Timber resources are most commonly found in forests and on other wooded land, which can be regarded as basic territorial units for collecting and summarizing information inputs. These resources are also found in other areas such as orchards, rubber plantations, along roadsides and train tracks and in city parks. Conceptually, timber resources in all of these areas are also within the measurement scope of the SEEA. In practice, the scope of measurement should be determined by the relative importance of the types of areas that provide timber resources (timber resources from different territories should be clearly differentiated).
The volume of these resources is often referred to as the volume of standing timber44 . This definition includes fallen trees; trees that have been felled but not removed from the area; and trees that have fallen from natural causes (e.g., disease or lightning strike) but are still useful for timber products or fuel. The volume of standing timber also includes dead trees that remain standing.
The volume of standing timber should be distinguished from the growing stock which relates to living trees and is the basis for calculation of the natural growth in timber resources over a period.
Physical asset accounts for timber resources
The physical asset account for timber resources records the volume of timber resources at the beginning and end of the accounting period and the change in this stock over an accounting period. The analysis of natural growth of timber resources compared with their removal is of particular interest.
The basic structure of a physical asset account for timber resources is presented in Table 1.17. The assets account should distinguish between the types of timber resources and, most importantly, between cultivated and natural timber resources. For natural timber resources a distinction should be made between timber resources available for wood supply and those not available for wood supply, to ensure that the different scopes of the asset accounts in physical and monetary terms can be reconciled. Accounts by tree species may be compiled depending on the purpose of analysis and available data.
Table 1.17 Physical asset account for timber resources (thousands of cubic meters with bark)
|
Natural timber resources |
||
|
Available for wood supply |
Not available for wood supply |
|
|
Opening stock of timber resources |
8,000 |
1,600 |
|
Additions to stock |
||
|
Natural growth |
1,100 |
20 |
|
Reclassifications |
150 |
|
|
Total additions to stock |
1,250 |
20 |
|
Reductions in stock |
||
|
Removals |
1,000 |
|
|
Felling residues |
120 |
|
|
Natural losses |
30 |
20 |
|
Catastrophic losses |
||
|
Reclassifications |
150 |
|
|
Total reductions in stock |
1,150 |
170 |
|
Closing stock of timber resources |
8,100 |
1,450 |
|
Supplementary information |
||
|
Felling |
1,050 |
|
Source: UN, 2012a.
The asset accounts presented in the SEEA focus on timber resources found in forest areas and on other wooded land. It may, however, be of interest to develop estimates of the volume of timber resources in other areas.
Additions to stock. The stock of timber resources increases due to natural growth. This is measured in terms of the gross annual increment, i.e., the volume of increment over the reference period of all trees with no minimum diameter. The calculation of natural growth should be based on the timber resources available at the beginning of the accounting period. Increases in the area of forest land, other wooded land and other areas of land can lead to increases in the volume of available timber resources. This is not considered being a natural growth and is recorded in reclassifications.
Reclassifications may also occur as a result of changes in management practice that shift timber resources from cultivated to natural or vice versa.
Reductions in the stock. The stock of timber resources may decrease over an accounting period through removal and natural losses. Removals are estimated as the volume of timber resources removed from forest land and other wooded land during the accounting period. They include removals of trees felled in earlier periods and the removal of trees killed or damaged by natural causes. Removals can be recorded by type of product (e.g., industrial round wood or fuel wood) or by species of tree (e.g., coniferous or broad-leaved). Removals constitute the relevant variable for measuring the extraction of timber resources because the definition of the stock of timber resources includes trees that have been felled and are on the ground but have not yet been removed.
Felling residues need to be deducted in order to fully account for the change in the volume of timber resources over an accounting period. These residues are associated with the fact that, at the time of felling, a certain volume of timber resources consists of trees that are rotten, damaged or exceed size requirements. Felling residues exclude small branches and other parts of the tree that are excluded from the scope of timber resources. Estimates of felling residues can provide important information on the nature of forestry practice.
Natural losses are the losses of growing stock (i.e., living, standing trees) during an accounting period due to mortality from causes other than felling: insect attack, fire, wind throw and other physical damage. Natural losses only include losses that may be reasonably expected when considering timber resources as a whole. They are recorded only when there is no possibility of removing timber. All timber removed should be recorded as removals
Catastrophic losses occur and are recorded when there are exceptional and significant losses of timber due to natural causes. These losses can also occur when there is no possibility of removal. All timber removed should be recorded as removals
Depletion. Depletion is related to the sustainable yield of timber resources from forest land and other wooded land. More precisely, the sustainable yield of timber resources is the quantity of timber that can be harvested at the same rate into the future while ensuring that productive potential is maintained. The sustainable yield will be a function of the structure of the growing stock and needs to take into account both the expected natural growth and the natural losses of trees. Various biological and forestry models will need to be taken into account in estimating sustainable yield.
In physical terms, depletion of natural timber resources is equal to removals less sustainable yield. As a rule, some variation from year to year is to be expected in the relationship between estimates of sustainable yield and actual quantities of natural growth (less natural losses). Hence, depletion should be recorded only when removals are beyond normal year-on-year variations in quantities of natural growth.
It should be noted that the concept of sustainable yield used to define depletions does not take into account ecological sustainability of the surrounding ecosystems, which may also be affected by the felling and removal of timber resources.
Felling. While the entries considered above fully account for the change in the volume of timber resources over an accounting period, there may be specific interest in the volume of trees felled during the period relative to the volume of timber resources removed. Annual felling is equal to the volume of timber resources felled during an accounting period. Felling includes silvicultural and pre-commercial thinning and cleaning. Where available, estimates of the volume of felling may be included in the physical asset account as additional information.
Timber resources as a source of energy Sources of energy provided by natural and cultivated timber resources are recorded in the physical supply and use table for energy (UN, 2012a, Section 3.4). The basis for recording is measurement of the total energy that is actually sourced from timber resources rather than measurement of the total energy that might be sourced from timber resources. Conceptually, the stock of timber measured in the asset accounts includes the volume and value of timber resources that may be used for energy purposes, but no separate estimates are made. Where there is analytical interest and where data are available, it would be possible to construct asset accounts for timber resources, which are used for energy purposes. In this context, there could be a focus on resources that are considered being renewable sources of energy.
Monetary asset accounts for timber resources
Monetary asset accounts for timber resources consist in measuring the value of opening and closing stocks of timber and changes in the value of the stock over an accounting period. (Table 1.18)
Table 1.18 The structure of monetary asset accounts for timber resources (currency units)
|
Natural timber resource (available for wood supply) |
|
|
Opening stock of timber resources |
82,428 |
|
Additions to stock |
|
|
Natural growth |
11,334 |
|
Reclassifications |
1,546 |
|
Total additions to stock |
12,879 |
|
Reductions in stock |
|
|
Removals |
10,303 |
|
Felling residues |
1,236 |
|
Natural losses |
309 |
|
Catastrophic losses |
|
|
Reclassification |
|
|
Total reductions in stock |
11,849 |
|
Revaluations |
16,692 |
|
Closing stock of timber resources |
100,150 |
Source: UN, 2012a.
Most of the changes in the stock relate directly to changes recorded in the physical asset account. But there are also entries relating to the revaluation of timber resources, which are recorded when prices for timber change during an accounting period.
It may be that not all timber resources are available for harvest due to forest legislation and/or environmental and economic reasons. It is recommended that the volume of timber resources that cannot be harvested should be separately identified and should not be a part of overall calculations of the value of timber resources.
Estimates are made for the value of natural growth and the value of removals. For cultivated timber resources natural growth is considered an increase in inventories and the removal is trees is treated as a decrease in inventories. Following the SNA, only the change in inventories is usually recorded, but entries are recorded on a gross basis in the SEEA.
For natural timber resources, natural growth is not considered being an increase in inventories, since the growth of trees is not considered being part of a production process. The removal of timber resources represents the point at which timber resources enter the economy, and output is recorded at that point.
In line with its general definition (SEEA, 2012, section 5.4), resource rent can be derived as the gross operating surplus from the harvest of timber resources (after taking specific taxes and subsidies into account), less the value of the user cost of produced assets that are used in the harvesting process.
Defined in this way, the resource rent will implicitly include a share that should be attributed to the land on which the timber stands. This reflects the composite nature of this asset taken as a whole (UN, 2012a, section 5.6). In many cases, owing to the location of the land or the quality of the soil, the return on the land may not be large compared to the return on the timber resource. But where relevant (e.g., where the land may be potentially of value for other purposes), an estimate of the resource rent attributable to the land should be deducted for deriving an estimate of resource rent on timber resources.
Resource rent can be estimated more directly by using estimates of the value of the growing stock (stumpage price), which is the amount paid per cubic meter of timber by the harvester to the owner of the timber resources (government). The stumpage price itself may also be derived by deducting various harvesting costs from the roadside pickup prices (also called wood-in-the-rough or raw wood prices). The harvesting costs should include felling costs as well as costs of thinning (net of any receipts), other management costs and rent on the land. For natural timber resources, these additional costs may be very low or even zero. When timber resources are sold prior to felling, relevant contract prices may also be used with appropriate adjustments for the scope and coverage of the prices to align them with the concept of resource rent.
The stumpage prices can then be multiplied by estimates of the expected volume of standing timber per hectare at the expected harvesting age to yield estimates of future receipts. These future receipts are then discounted (over the time from the current period to the expected harvest period) in order to estimate a value per hectare for each age class. In turn, these values are multiplied by the total area of each age class and added to give the value of the total stock of standing timber. This approach should provide separate accounting for the harvesting of mature trees. A simplified approach is to use the current age structure and assume that each tree of a particular age grows to maturity and is harvested at maturity.
The primary difficulty in applying these NPV approaches is the extent to which information is available on the age structure of trees and how these trees will mature into the future. Where the necessary detail is available, these NPV approaches should be used, taking the modeling of future timber resources into account.
If detailed information on the future age structure is not available, two methods are commonly applied. The stumpage value method multiplies the average stumpage price across all maturities of felling by an estimate of the current volume of timber resources. The consumption value method requires information on the current age structure of the timber resources and stumpage prices for different maturities of standing timber.
While these two methods are variants of basic NPV approaches, the assumptions underpinning then may be very restrictive, particularly in case of a changing age structure of timber resources due either to over-exploitation or to active afforestation.
In general terms, the valuation of flows of timber resources (including removals, natural growth, depletion, etc.) should be undertaken using the same in situ resource prices, which underlie the valuation of the opening and closing stock of timber resources. The relevant approaches are described in Annex A5.1 of the SEEA 2012.
With respect to catastrophic losses, due, for example, to wind throws or forest fire, the value of the wood that is salvaged should be taken into account. Prices may rise following the destruction of timber resources due to fire or they may fall if trees are killed but not destroyed in storms. The price changes will reflect changes in the pattern of timber available for supply. Further, the stumpage value of the salvaged timber has to be accounted for in the value of the stock for the period until its removal from the forest, which, in some cases, may take a number of years.
Other changes, which affect the value of stocks of standing timber as a resource for the logging industry, are changes in use or status (e.g., when forests are protected and logging is prohibited). In this case, the value of the standing timber, in terms of income from the sale of timber resources, is reduced to zero.
An increasingly important consideration is the assessment of carbon sequestration. As part of a broader accounting of carbon sequestration and other carbon stocks and flows, estimates of the amount of carbon bound in timber resources and the changes in this amount over an accounting period can be derived using information on the opening and closing volume of standing timber and changes in volume. Estimates can be derived by applying relevant average coefficients for both the relationship between the volume of standing timber and the total biomass (including above- and below-ground biomass) and the relationship between the biomass and quantities of carbon. These coefficients will vary with the species of the tree and other factors.
A carbon account for timber resources can be developed based on the structure of physical asset accounts for timber resources (see Table 1.17)
It should be noted that references to reductions in the stock of carbon in timber resources (e.g., due to removals) do not imply that carbon has been released into the atmosphere. In general, carbon will remain bound in timber until the timber is burned or decomposes naturally, and these releases of carbon will not be recorded in a carbon account for timber resources.
Asset accounts for animal resources
The structure and logic of accounting of animal resources is similar to timber resource accounts (Table 1.19).
Table 1.19 Structure of a physical asset account for animal resources (thousands of individuals)
|
Animal resources (by species) |
|
|
Opening stock of animal resources |
100 |
|
Additions to stock |
|
|
Natural growth |
15 |
|
Reclassification |
- |
|
Total additions to stock |
15 |
|
Reductions in stock |
|
|
Extractions |
5 |
|
Natural losses |
7 |
|
Catastrophic losses |
2 |
|
Reclassification |
- |
|
Total reductions in stock |
14 |
|
Closing stock of resources |
101 |
There are several types of processes that may lead to an increase or decrease in the amount of animal resources, and they generally correspond to positions in natural resource accounts, subject to some adjustment and specification.
Additions to stock These refer to increases in stock of game over an accounting period as a result of actual growth and spread of animals due to: `
1) natural factors, excluding any human involvement;
2) special biotechnology measures to promote natural regeneration.
An increase in stock may result from the reclassification of game assets in situations where certain species acquire the status of game. Reclassification may also be related to changes in the assets due to improvements of game husbandry, game use technologies, etc.
Reductions in the stock. The stock of animal resources may decrease during an accounting period as a result of physical extraction (shooting, catch, harvesting), natural and catastrophic losses. Physical extraction refers to the volume of the stock of animal resources removed from hunting areas and other territories during an accounting period Physical extraction can be recorded by families (e.g., hoofed, upland game, fur game, etc.) or by species (e.g., moose, wood grouse, sable, etc.).
Natural losses represent a decrease in the number of game due to natural aging and death, losses caused by predators and diseases, by forced migration and other factors. These processes do not include events of a mass, large-scale and one-off nature, resulting from disasters and/or catastrophic events. Systematic natural decline can usually be forecast based on information about real conditions and processes, as well as on experience gained, and long-term gathering and analysis of relevant data.
Catastrophic losses occur as a result of phenomena that are large-scale, one-off, anomalous and unpredictable (though actually accounted for) and lead to the destruction (death) of a considerable volume of resources. As regards game resources, such losses may include:
- epidemics that kill many animals;
- losses due to earthquakes, volcanic eruptions, mud flows and avalanches (in mountain forests), catastrophic floods, acute frosts or prolonged drought, etc.
- consistent with the SEEA 2012 approach, such losses can also be caused by various man-made factors, such as warfare, oil spills in the course of extraction or transportation, significant radioactive emissions.
Reductions in stock can occur due to reclassification of game assets after certain species have been transferred to the category of rare and endangered animals whose hunting is prohibited.
The most suitable basis for valuation of animal resource assets and liabilities is the price at which they could be purchased on the market at the moment of valuation. Ideally, the prices used should be prices, which are observed on the market or which can be estimated by observing market prices.
1.3.2.3. Functional accounts (environmental activity accounts)
The record of transactions (in monetary terms) related to activities intended to preserve and protect the environment represents an important element in environmental-economic accounting. The goal of identifying the environmental component in key SNA aggregates is adequate justification for keeping such records. Further, information on these transactions may be used, in combination with information on the changing pressures on the environment, to help assess whether economic resources are being used effectively to reduce pressures on the environment and to maintain the capacity of the environment to provide ecosystem services.
The scope of environmental activity comprises those economic activities whose primary purpose is to reduce or eliminate pressures on the environment or to make more efficient use of natural resources. Examples of such activities include the reclamation of polluted territories, preservation and management of resources, as well as investments in technologies to prevent or mitigate environmental pollution.
These various activities are grouped into two broad categories: environmental protection and resource management (resource use). Environmental protection activities have the primary purpose of preventing, reducing and eliminating pollution and other forms of degradation of the environment. Resource management activities have the primary purpose of preserving and maintaining the stock of natural resources and hence safeguarding against depletion.
The general structure of classification of environmental activities is presented in Table 1.20.
Table 1.20 Classification of Environmental Activities
|
Group |
Classes |
|
I. Environmental protection45 |
1. Protection of ambient air and climate 2. Wastewater management 3. Waste management 4. Protection and remediation of soil, groundwater and surface water 5. Noise and vibration abatement (excluding workplace protection) 6. Protection of biodiversity and landscapes 7. Protection against radiation (excluding external safety) 8. Research and development for environmental protection 9. Other environmental protection activities |
|
II. Resource management |
1. Management of mineral and energy resources 2. Management of timber resources 3. Management of aquatic resources 4. Management of other biological resources (excluding timber resources and aquatic resources) 5. Management of water resources 6. Research and development work for resource management 7. Other resource management activities |
Source: UN, 2012a, p. 106.
Environmental activity accounts include environmental protection expenditure accounts and resource management expenditure accounts.
Environmental protection expenditure accounts (EPEAs) are functional accounts. Their purpose is to identify and measure society’s response to environmental concerns by estimating supply and demand for environmental protection services and by assessing production and consumption behavior, which prevents environmental degradation. EPEAs present information on the scope of environmental protection services across the economy and on the expenditure of resident units on all goods and services in this sphere.
There are four main, interlinked EPEA tables:
- production of environmental protection services;
- supply and use of these services;
- total amount of national expenditure on environmental protection;
- financing of national expenditure on environmental protection;
Information on provision of environmental protection services by resident producers is given in Table 1.21. These services are provided by economic units for sale or for their own use. Production of environmental protection services is presented with a breakdown between specialist producers, non-specialist producers and own-account producers. Government specialist producers are separately identified.
Table 1.21 Production of environmental protection services (monetary units)
|
|
Producers |
Total |
|||
|
Specialist producers |
Non-specialist producers |
Own-account producers |
|||
|
Government specialist producers |
Other specialist producers |
||||
|
Output of environmental protection services; |
3,000 |
6,500 |
2,400 |
1,600 |
13,500 |
|
Intermediate consumption |
2,000 |
3,000 |
600 |
400 |
6,000 |
|
Environmental protection services |
1,800 |
1,500 |
500 |
300 |
4,100 |
|
Other goods and services |
200 |
1,500 |
100 |
100 |
1,900 |
|
Gross value added |
1,000 |
3,500 |
1,800 |
1,200 |
7,500 |
|
Remuneration of employees |
600 |
2,000 |
1,200 |
800 |
4,600 |
|
Taxes less subsidies on production |
|||||
|
Consumption of fixed capital |
400 |
1,000 |
600 |
400 |
2,400 |
|
Net operating surplus |
500 |
500 |
|||
|
Supplementary items |
|||||
|
Labor input (hours worked) |
4,000 |
10,000 |
4,500 |
4,000 |
22,500 |
|
Gross fixed capital formation |
1,100 |
1,000 |
2,000 |
500 |
4,600 |
|
Acquisition less disposal of non-produced, non-financial assets |
200 |
||||
Source: UN, 2012a, p. 111.
All amounts in Table 1.21 are measured in compliance with generally accepted SNA accounting practice. Consequently, aggregates such as gross value added and net operating surplus can be meaningfully compared with macroeconomic aggregates such as gross domestic product (GDP) as derived from the core national accounts framework. Inclusion of own-account production extends the range of entries compared with that of the core national accounts. So measures of output and intermediate consumption will be larger in the EPEA relative to the core accounts than they would be if this activity were not separately identified.
The supply and use table for environmental protection services (Table 1.22) reflects the total supply of specific services by resident producers and the rest of the world and the use of environmental protection services by various economic units. The top half of the table (the supply table) shows the supply of specific services from the output of resident producers and from imports, and the link between the output of specific services valued at basic prices and the valuation of this output at purchasers’ prices. In the second half of this table (the use table), the total supply of specific services is shown as:
a) intermediate consumption by a specialist or other producers;
b) final consumption by households or governments;
c) gross fixed capital formation
d) exports to the rest of the world.
All entries in the use table are in purchasers’ prices.
Table 1.22 Supply and use of environmental protection services (monetary units)
Supply table
|
Output at basic prices |
Taxes less subsidies on products |
Trade and transport margins |
Output at purchasers’ prices |
Imports |
Total supply |
||
|
Environmental protection services |
13,500 |
270 |
|
13,770 |
|
|
13,770 |
|
Use table |
|||||||
|
Intermediate consumption |
Final consumption |
Gross fixed capital formation |
Exports |
Total use |
|||
|
Specialist producers |
Other producers |
Households |
Government |
||||
|
Environmental protection services |
{0}1,500 |
7,400 |
2,970 |
1,800 |
100 |
|
13,770 |
Source: UN, 2012a, p. 112.
The table of total national expenditure on environmental protection is important for the estimation of environmental protection spending. What is included is all expenditure on goods and services used for environmental protection as follows:
1) environmental protection services;
2) expenditure on connected products;
3) expenditures on adapted goods.46
The table also includes total fixed capital formation for environmental protection purposes by a specialist, non-specialist and own-account producers, and the respective transfers for environmental protection work. Recording of these flows in the table ensures measurement of total spending in the economy for purposes that are reflected in the aggregate indicator of national expenditure on environmental protection.
The following table which shows financing of environmental protection, is a continuation of the table on total national expenditure on environmental protection and is designed to show indicators for the financing of government expenditures on environmental protection.
Overall, the total amount of national expenditures on environmental protection is defined as follows:
- final consumption, intermediate consumption and gross fixed capital formation for all environmental goods and services (specific services, connected products47 and adapted goods), except intermediate consumption and gross fixed capital formation for typical activities;
- plus gross fixed capital formation (and acquisitions less disposal of non-produced non-financial assets) for typical environmental protection activities;
- plus transfers by resident units that are connected with environmental protection and are not captured in the items above;
- plus transfers connected with environmental protection, which are paid to the rest of the world;
- minus transfers connected with environmental protection, which are received from the rest of the world.
Resource management expenditure accounts include accounts covering supply of resource management services and use of resource management services, national expenditure on resource management and financing of national expenditure on resource management. It may be relevant to compile resource management expenditure accounts for a specific type of resource (e.g., timber resources or water resources) (UN, 2012a, Chapter 4).
1.3.2.4. Experimental ecosystem accounting
Experimental ecosystem accounting is an important element of the general system of environmental-economic accounting. Its basic methodological provisions are presented in the System of Environmental-Economic Accounting, 2012: Experimental Ecosystem Accounting. Although experimental ecosystem accounts are not currently a statistical standard, they provide a consistent and coherent synthesis of current knowledge regarding an accounting approach to the measurement of ecosystems within a model that complements the SEEA 2012. The main purpose of developing an appropriate accounting system is to integrate information regarding the environment (including information on environmental protection) with economic information in order to weigh various options for taking management decisions. Within this context, the more specific objectives in establishing an accounting structure are:
- organizing information on the environment from a spatial perspective, describing, in a coherent manner, linkages between ecosystems, economics and other human activities;
- applying a common, coherent and integrated set of concepts, classifications and terminology to enable coordinated work and consistent research;
- enabling connections with environmental-economic information obtained during implementation of the SEEA 2012. Such linkages would help to understand and assess the contribution of ecosystem services to economic activities (production, consumption and accumulation), establishing the specific linkage of degradation, restoration and development (enhancement) of ecosystems to specific economic units. This also includes a broader and more comprehensive evaluation of national wealth;
- identification of information gaps and key information requirements.
One of the main aspects of ecosystem accounting is a recognition of the fact that the ecosystem can provide a range of services that help to create the benefits that are used in the economy and other human activities. In some cases, ecosystem services can be enjoyed in combination and in harmony with other services, e.g., the preservation of wooded land also provides air filtration and opportunities for recreation and hiking. In other cases, ecosystem services can be of a competitive nature. For instance, felling in a forest area accrues benefits in the form of a timber harvest. However, it also reduces opportunities for recreation. Ecosystem accounting allows these contradictions being examined in order to make efficient management decisions.
Experimental ecosystem accounting uses three interrelated categories (groups) of services48
1. Provisioning services comprise material and energy contributions provided in or by ecosystems, e.g., fish resources or medicinal plants with pharmaceutical properties.
2. Regulating services arise from the ability of ecosystems to influence climate regulation, hydrological and biochemical processes taking place on the earth, and various biological processes. Quite often, these services are territory specific. For example, services for control (self-regulation) of floods, which are provided in wooded areas located upstream, are only significant for flood-prone areas located downstream from the wooded areas.
3. Cultural services are shaped by physical features, location or a specific situation. These factors produce intellectual and symbolic benefits that the population receives from ecosystems in the course of recreation, leisure and spiritual development. The benefits may also include actual visits to places that in some way support ecosystems (e.g., by showing films about nature) or help people to realize that ecosystems need to be preserved, since they contain important elements of biodiversity or cultural monuments.
The SEEA experimental ecosystem accounts describe the measurement of ecosystems in physical terms and also in monetary terms to the extent that monetary measurement can be carried out in compliance with the principles of market value. Many of the structures for accounting of ecosystems are taken from the SEEA Central Framework and the SEEA 2012 accounting approaches are consistently applied.
In the SEEA approach for deriving estimates of economic value of environmental resources and ecosystem services, based on the concept of total economic value, the value of a good or service is used as an indicator of its utility and is determined by its scarcity. What is plentiful and available to everyone does not have any economic value, however desirable it may be from ethical, esthetic and other points of view. Sunshine or a beautiful landscape does not have any value for so long as it is free and available to everybody. If they cease to be freely available, they acquire potential economic value. If beautiful landscapes are ruined by urban development or if clean air is polluted, these benefits become scarce. People are beginning to discover their preferences in respect of environment quality. In this context, the “quality of the environment” is similar to a good that has become scarce. Its value hypothetically increases as its scarcity increases, and the value can be estimated on the basis of what people are willing to pay for restoration of its quality or for protecting themselves by various methods from its further deterioration.
If there is a market for the good or service, their scarcity is measured by price. In a simplified, timeless world, all goods are traded in perfect markets and market prices are truly socially weighted prices, which directly determine the distribution of resources for their most beneficial use. In real life, there are no perfect markets. With regard to environmental resources and ecosystem services, this means that only some of their value is reflected in market prices, while the remainder (their costs and benefits) cannot be identified in market processes. Since certain costs and benefits related to the environment are not accounted for in markets, their economic value is frequently ignored in the assessment of development projects and decisions.
It should be noted that even in a developed market, existing prices only partially reflect the value of environmental resources and ecosystem services. As a result, misconceptions arise about their scarcity; socio-cultural views of the value and expediency of use of any particular resource are ignored. In other words, the market system in its current form is unable to distribute resources effectively, i.e., to assign just economic value to their destructive use. This is referred to as market failures (Insert 1.2).
Insert 1.2
Causes of market failures
So-called market failures are caused by the following factors. First of all, they may be due to the absence of prices for many environmental resources and the absence of the respective markets (the Earth’s atmosphere, waterways, large ecosystems, landscapes, sound and electromagnetic spectra, etc.). For example, resources such as air and water have not traditionally had a price or their price has been hugely understated, leading to excessive use and deterioration of their quality. The situation is complicated by the social character of many natural goods which cannot be owned privately and are accessible free of charge. Nevertheless, natural goods, although they are not goods in the usual sense and exist outside the market system, constitute a factor of production, i.e., they enter the system and generate net profit. In addition, the usual practice of economic analysis does not include externalities when assessing project costs and decision-making. Externalities refer to the external effects of the activity of one firm (or individual) upon other firms, groups or individuals who are not directly involved in the activity in question. For example, cutting down trees on a hillside increases deposits in a river, leading to problems and additional costs for farms downstream, which must carry out remedial action. So expenses incurred by one economic unit have to be recouped by other units. Serious problems may also arise from such factors as inevitable transaction costs (time and labor costs incurred in the process of executing agreements and covenants when sharing the use of natural resources, as well as expenses on negotiations and consultancy, obtaining information, etc.) and from uncertainty over the definition of property rights for environmental resources. Finally, there is uncertainty due to lack of understanding of the consequences of economic activities, given the irreversible character of environmental processes, and this is compounded by short-term views of decision-makers in dealing with environmental issues (priority given to short-term results, ignoring long-term interests). All of this leads to the depletion of environmental resources, accumulation of waste and transfer of the burden of these problems to future generations.
According to the SEEA approach, current market estimates of the value of environmental resources should be adjusted to take account of all relevant value factors, thus neutralizing market failures and evaluating environmental resources and ecosystem services more adequately. This approach is based on the concept of total economic value of environmental resources in the context of links between the environment and the economy (Fig. 1.7).
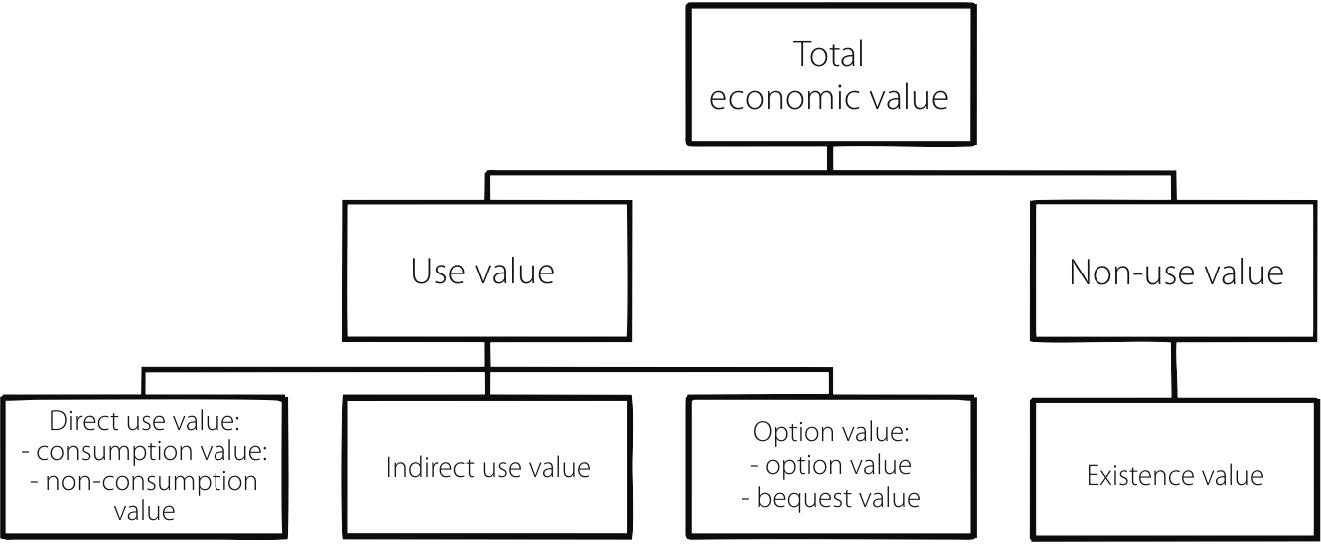
Fig. 1.7 Typology of values of environmental resources and ecosystem services
The breakdown of total economic value and the respective terminology may differ, but in the framework of the concept the value of a good or service is considered comprising:
1) direct use value;
2) indirect use value;
3) option values;
4) non-use value.
The first three components constitute the integrated concept of the “use value.”49
Direct use values refer to ecosystem goods and services that are directly used by people. They include the value of consumption use, such as timber harvesting for construction and for fuel, procurement of medicinal plants and hunting for use in food; and the value of non-consumption use, such as cultural appreciation and recreation activities, which do not imply the extraction of material benefits. Most commonly, benefits of direct use are enjoyed by people visiting or inhabiting the respective ecosystem.
Indirect use values are derived from ecosystem services that provide benefits outside the ecosystem itself. Examples may include wetlands that have a water filtration function, which is often beneficial for people living further downstream; mango groves protecting coasts against storms, with positive effect for coastal assets and infrastructure; and carbon absorption, which is beneficial for people everywhere as it slows down climate changes. These functions often impact activities whose value can be measured, making it possible to evaluate them as such.
Option value is understood as the retention of possible future use of goods and ecosystem services, which cannot be used at present: by someone now (option value per se) or by other people/successors (bequest value)50 . Provisioning services as well as regulating and cultural services may together form a part of option value if they are not used in the present, but might be used in the future.
Non-use value refers to utility derived by people from knowing that a certain resource exists even if they will never enjoy it directly. This value is often referred to as existence value or value of passive utilization.
A number of approaches to the valuation of different types of utility of environmental resources and ecosystem services are applied in order to derive a monetary estimate of all components of economic value.
The concept of total economic value of environmental resources is based on the idea that these resources can have utility for people regardless of whetherthey are brought into circulation in the economy. Therefore, the methods of economic valuation of environmental resources and ecosystem services within the SEEA framework are based, firstly, on an in-depth analysis of links between the environment and the economy (human activity) in physical terms and, secondly, on monetary estimate of all aspects of the utility, which these links generate for people. These approaches enable the fullest possible account of the economic value of environmental resources and ecosystem services
It should be noted that since the first edition of the UN handbook on national accounting (Integrated Environmental and Economic Accounting (1993)) was published, work for improvement of the methods of environmental-economic accounting has been continuing worldwide, drawing on the experience accumulated by various government units, research organizations and expert communities
The main documents summarizing findings in this sphere are: Handbook of National Accounting: Integrated Environmental and Economic Accounting, 1993; Handbook of National Accounting: Integrated Environmental and Economic Accounting, 2003; and Central Framework of the SEEA, 2012.
The SEEA-1993 was published as a work in progress because it was recognized that further conceptual discussions and testing of methodology were required. Drawing on the experience and major achievements obtained in various countries, the revised SEEA handbook showed significant progress in the unification of terms and definitions. Nevertheless, in many cases the methodology still retained the form of a collection of alternative approaches to implementation of the SEEA principles and of the latest experience in the sphere. Recognizing the urgent importance of integrated information on linkages between the economy and the environment and based on technological achievements in that sphere, the United Nations Statistical Commission approved (at its 38th Session in 2007) the start of work on a second revision of the handbook in order to upgrade the Central Framework of the SEEA into an international statistics standard.
The Central Framework of the SEEA, 2012 is based on agreed accounting concepts, definitions, classifications and rules. As an accounting system it allows all information being arranged in the form of tables and accounts in a conceptually consistent manner. This information helps to derive coordinated indicators that can be used in compiling accounts and addressing a wide range of issues. The focus is on market valuation tools as being most consistent with approaches to asset valuation in the SNA, particularly with regard to their specification and practical application. However, the conceptual basis of physical and monetary accounting of environmental resources and ecosystem services within the SEEA has remained unchanged.
The framework for deriving estimates of total economic value of environmental resources and ecosystem services in the SEEA-1993 combines a number of sets of methods. In the present section these methods are treated in conformity with the UN (1994b) classification. Three basic approaches to deriving estimates of economic value of environmental resources and ecosystem services are applied in the framework of the SEEA:
- market valuation;
- direct non-market valuation (including willingness to pay)
- Indirect non-market valuation (including cost data on, for example, damage costs or costs incurred in meeting certain standards).
The general scheme for applying these methods in the valuation of specific environmental resources and ecosystem services is presented in Table 1.23.
Direct market valuation. Consistent with the guiding principles of the SEEA, the following approaches to market valuation of environmental resources can be distinguished:
- Factual market prices of environmental resources This type of valuation can be applied if market transactions involving this resource are sufficiently representative. Factual market prices are particularly relevant for transactions with land plots that do not have any special conservation status. However, environmental resources usually cannot be traded in this way;
- present (discounted) value of future net proceeds Future net proceeds are defined as the net operating surplus that could be associated with the use of environmental resources (less standard operating profit that could have been earned if the funds invested in the use of the assets concerned had been used for other activities that carry a similar degree of risk). This approach can be used to determine the economic value of most environmental resources used in the economy (forest, water, etc.)
There is some uncertainty regarding estimation of the standard profit element in net price, particularly when the operating surplus (before subtraction of standard operating profit) is already relatively small. In this case, the net price could become negative after the deduction of standard profit. However, it is important not to be misled by this result, as it may show that market prices of the resource are so low that even a standard return on invested capital cannot be achieved. The method of user cost is normally applied to evaluate depletion of mineral resources. This method avoids the application of negative net prices by dividing the actual operating surplus into two parts: user costs, which should be invested to achieve a constant flow of income in the future (even after the complete exhaustion of the resource), and a remaining true income element (Salah, 1989; 1991).
Table 1.23 Valuation and use of environmental resources
|
Type of valuation |
Use of environmental resources |
||||
|
Biological |
Land (including ecosystems) |
Subsoil |
Water |
Air |
|
|
Market direct |
Market prices (produced biota) Market valuation of net returns (wild biota) |
Market prices |
Market valuation (net return from exploitation) |
Market prices (direct water use) Market valuation of net returns (water uptake) |
|
|
Direct non-market |
Existence values of animals and plants |
Esthetic, recreational value of landscape Existence value of ecosystems |
Evaluation of decrease in water quality (willingness to pay) Evaluation of the existence value of aquatic ecosystems |
Evaluation of decrease in air quality (willingness to pay) |
|
|
Indirect non-market |
Costs of balancing depletion and natural growth |
Costs of preventing land degradation by pollution, agricultural or recreational use |
Costs of providing alternative income sources |
Costs of maintaining the average level of water bodies Costs of preventing reduction of the quality of water by pollution |
Actual damage costs caused by reduced air quality Costs of preventing a reduction of air quality due to pollution |
If environmental resource use is not associated with market transactions, non-market direct or indirect valuation must be applied.
Direct non-market valuation Direct non-market valuation techniques (contingent valuation) may be applied especially for qualitative (and quantitative) use of the natural environment as a good for public consumption (Johansson, 1990; Pearce, Markandia & Barbier, 1989; Salah, 1989). Examples are value of the use of water and air or the value or recreational services provided by natural resources. It is often impossible to evaluate environmental resources as a whole; only the economic value of reductions or additions to the respective environmental services can be evaluated. One example is valuation of a unique landscape. The public may be asked how much they would be willing to pay to prevent the deterioration of the landscape. With certain allowances, this amount can be viewed as the value of decrease in quality of the landscape.
The most common approaches in direct non-market valuation are based on willingness to pay and receive compensation. Other methods apply hedonic property prices, wage risk studies and travel cost approaches. It should be mentioned that these methods can be applied, not only for valuation of the different functions of environmental resources but also to value natural and cultural heritage sites (e.g., historical monuments), which have no market value.
Direct non-market valuation has its critics. Many economists doubt whether it is really possible to determine monetary values for preferences in the absence of markets (Huenting, 1980). The usual arguments refer to intractable conceptual problems and an inadequate database. On the other hand, these valuation methods frequently offer the sole means of approximating the value of a wide range of functions of the natural environment. These valuation techniques are especially important for the design of environmental protection procedures at local level, when willingness to pay is a vital tool for determining the level of local charges and their differentiation.
Indirect non-market valuation Indirect non-market valuation of environmental resources uses actual or hypothetical cost data. Actual costs comprise expenditures incurred for maintaining the resources of the natural environment. Examples are environmental protection costs or expenditures for the mitigation of damage (e.g., to human health or materials) caused by worsening of environment quality. Expansion of environmental protection work for the prevention or repair of degradation may indicate that a reduction in the quality of environmental assets due to economic activities has been avoided or made good. The valuation based on avoidance or repair cost may not be adequate, since the environmental protection activities might not be sufficient to offset the negative impacts of economic activities on the environment. The actual damage costs incurred are thus in general only a lower limit for valuing the reduction of environment quality. People may be assumed to be willing to pay at least the amount of their factual expenditures for countering the effects of worsening air and water quality. So these expenditures could be interpreted as the (minimum) value of the reduction of environment quality
It should be noted that the design of various techniques for the economic valuation of environmental resources and ecosystem services is an ongoing process, which presupposes the appearance of new approaches. Each of the techniques should be assessed by its applicability to environmental-economic accounting and in comparison with other methods.
Valuation of specific items should be in accordance with current and potential trends in their use, taking account of environmental issues that arise in the process. It is desirable to apply various approaches to the valuation of specific items in order to obtain more adequate and comprehensive information, which can be used as the basis for decisions on environmental management.
The features of specific territories are of critical importance when selecting methods for the economic valuation of environmental resources and ecosystem services. These features include the nature of environmental issues, the social and economic situation, and socio-cultural peculiarities.
Consistent with the SEEA 2012, the most adequate approach to valuation of environmental assets is the net present value method (UN, 2012a). There are five components of this method for valuing environmental resources:
1. Measurement of returns on environmental assets;
2. Determination of the expected pattern of resource rent based on expected extraction (exploitation) profiles and prices;
3. Estimate of the lifetime (service life) of environmental assets;
4. Selection of a rate of return on produced assets, which are deployed in extraction (exploitation) of the environmental resource;
5. Choice of discount rate.
Measurement of returns on environmental assets
In the SEEA, returns are defined using the concept of economic rent. This rent is best defined as the surplus value accruing to the extractor or user of an asset, calculated after all costs and standard returns have been taken into account.
The surplus value, referred to in the context of environmental resources as a resource rent, can be taken to be the return attributable to the asset itself. The logic of environmental resource valuation requires assessment of the resource rent flows that are expected in the future, after which these resource rent flows are discounted back to the current accounting period. This provides an estimate of the value of the asset at the given point of time.51
The measurement of resource rent provides a gross measure of the return on environmental assets. With regard to these assets, it is also relevant to consider the derivation of a net measure of the return by deducting depletion from resource rent, i.e., depletion-adjusted resource rent. For produced assets, the equivalent deduction is for depreciation. Depletion reflects the change in the value of an environmental asset that is due to extraction in excess of regeneration. Putting aside any changes in expectations for future returns or differences between expected and realized outcomes, the measure of depletion-adjusted resource rent corresponds (in economic terms) to a net return on capital or net return on environmental assets.
Resource rent and net return on environmental assets can be derived on the basis of the operating surplus earned by extracting enterprises. In this context, the operating surplus earned by an enterprise is considered comprising a return on investments in produced assets and a return on the environmental assets used in production.
Table 1.24 presents the standard derivation of gross operating surplus based on the SNA and SEEA using measures of output, intermediate consumption, employee remuneration and other taxes on and subsidies for production.
Table 1.24 Relations between different flows and income components
Source: UN, 2012a, p. 167.
Before deriving measures of resource rent, account must be taken of any specific taxes relating to extraction. Specific taxes and subsidies are those that apply solely to extracting enterprises and are not generally applicable across the economy.54 Examples include subsidies that are provided based on the quantity of resources sold and taxes levied on factors of production used in the extracting industries. The deduction of specific subsidies from and the addition of specific taxes to the standard national measures of gross operating surplus are such that the resulting measure of resource rent is neutral in respect of these flows: i.e., although these flows affect incomes of the extracting industries, they are effectively redistribution within the economy and should not influence the predicted return on the underlying environmental assets.
Thus, resource rent is derived from standard measures of gross operating surplus by deducting specific subsidies, adding back specific taxes and deducting the user costs of produced assets (which include consumption of fixed capital and return on produced assets).
Estimation of resource rent and its expected dynamics
The SEEA 2012 framework offers three main approaches to estimating resource rent: the residual value method, the appropriation method and the access price method.
The most commonly applied method is the residual value method. Under this method, resource rent is estimated by deducting user cost of produced assets from gross operating surplus after adjusting for any specific subsidies and taxes.
Estimates of the values of gross operating surplus and specific subsidies and taxes can be obtained from national accounts data Estimates of the user costs of produced assets are not generally available and must be construed so that the resource rent for each period can be obtained. Estimates of the user costs of produced assets are composed of two variables: consumption of fixed capital of produced assets and standard return on produced assets. Both variables can be estimated within national account models designed to estimate the value of the fixed capital stock and related variables for various purposes, including productivity analysis. If such models have not been developed, each variable can be measured using assumptions about depreciation rates, asset lives and rates of return on produced assets. A full description of considerations and approaches relevant to the measurement of user costs is presented in Measuring Capital: OECD Manual – 2009.
A difficulty in estimating resource rents with this method is that it is only rarely possible, using the available source of information, to isolate the extraction or harvesting activities alone. In certain circumstances, multiple resources may be extracted and used at the same time, particularly in mining. Generally, data on gross operating surplus for industries that extract and harvest environmental assets will capture some downstream processing, refinement or other value-added activity also undertaken by the extractor before sale. Since all of these additional activities require inputs of labor and capital, partitioning a firm’s gross operating surplus into pure extraction activity relating to a single resource is not always straightforward. Nevertheless, every effort should be made to isolate the specific gross operating surplus for the extraction of individual resources in the underlying data.
Besides, in situations of over-exploitation of resources the resulting gross operating surplus will generate a higher estimate of resource rent that can be sustained over the longer term. While this observation is correct, it does not invalidate the approach based on measurements of rent. The aim of this approach is not to measure what might or should happen under ideal circumstances but to account for expected behavior in respect of a particular environmental asset. Thus, if over-exploitation continues, it should be reflected in a shorter remaining asset life and in a greater amount of depletion (as a component of the higher resource rent) than might otherwise be the case.
The appropriation method estimates the resource rent using the actual payments made to the legal owner of environmental assets (government). As the legal owner of environmental assets, the government can collect the entire resource rent derived from extraction of the natural resources that it owns. This amount would in theory be equal to gross operating surplus less user costs of the produced assets of extractors.
The collection of resource rent is generally undertaken by governments through mechanisms such as fees, taxes and royalties. In practice, the fees, taxes and royalties actually collected tend to understate total resource rent, as the rates may be set with other priorities in mind (apart from earning income), e.g., encouraging investment and employment in the extracting industries. These alternative motivations should be considered before use of the appropriation method.
The access price method is based on the fact that access to resources may be controlled through the purchase of licenses and quotas as is commonly observed in the forestry and fishing industries. When these resource access rights are freely traded, it is possible to estimate the value of the relevant environmental asset from the market prices of the rights. The economic logic here parallels the residual value method, since it is expected that, in a free market, the value of the rights should be equivalent to the future returns on the environmental asset (after deducting all costs, including user costs of the produced assets).
Where the resource access rights that are purchased provide very long or indefinite access to the assets, the market value of the rights should provide a direct estimate of the total value of the asset rather than simply an estimate of the resource rent. In this case, no discounting of future flows of resource rent is needed. If the rights are for a limited period (e.g., for one year in the case of entitlements), this can provide a direct estimate of the resource rent for that period. In practice, governments may give the access rights direct to extractors for free or at a price that is less than the true market value.
While in theory, all of these methods will generate the same estimates of resource rent, it is the case that the application of the appropriation and access price methods are more heavily influenced by the institutional arrangements in a country. For these reasons, estimates of resource rent based on the residual value method should be compiled and, where possible, reconciled with estimates obtained using the other methods.
The critical factor in the valuation of assets is not past or current returns, but expected future returns. An asset with no expected returns has no value in economic terms. Expected returns are, by definition, unobservable, so assumptions have to be made in respect of them.
Resource rent is a function of quantities extracted, unit extraction costs and commodity prices. The starting point is generally estimates of resource rent in the current period or in the immediate past. In the absence of additional information on expected price changes or changes in extraction rates, it is recommended that estimates of resource rent should be set based on current estimates of resource rent, assuming no price changes beyond the general level of inflation and a realistic rate of extraction.
In general, there is too much volatility in unit resource prices for meaningful assumptions about future resource price changes to be incorporated. Also, in the absence of other information, it may be reasonable to assume that extraction will continue at the same rate as in the past, since this is the extraction rate at which an appropriate amount of produced assets can be acquired. However, if, for example, it is known that the greater part of the expected resource rent will be earned in years 5 to 10 over a total asset life of 30 years, this timing of expected returns should be taken into account.
Special consideration is needed in situations where the extraction rates in any particular period might be considered abnormal, including where they fall to zero. In practice, this is possible in any given accounting period, e.g., if the change in economic circumstances is such that extraction is no longer cost-effective, natural disasters make the resource inaccessible or unharvestable, or access to resources is restricted to allow the recovery of stocks.
If changes occur in the expected extraction/use schedule, the resulting NPV estimates may produce results that are difficult to interpret. However, this only highlights the fact that, when the expected extraction schedule changes for any reason, including simply the receipt of additional information, the estimates must be redone, since they need to reflect a valuation based on all the information that is available at that point of time.
Estimates of environmental asset life
The asset life (or resource life) is the expected time during which an asset can be used in production or the expected time during which extraction of a natural asset can be continued. With respect to renewable resources, estimates of asset life/exploitation are based on the available physical stock of the asset and the assumed rates of its extraction and growth. In a very simple case, the asset life can be calculated by dividing the opening physical stock by the excess of expected annual extraction over expected annual growth.
Estimates of the asset life provide the time frame, during which measurements are made. In practice, depending on the choice of discount rate, if the asset life is longer than about 20 years, estimates are relatively stable; that is, the values of the expected returns in later years are relatively small. The sensitivity of the NPV estimates to the choice of discount rate over varying asset lives is discussed in SEEA 2012.
Rate of return on produced assets
An expected rate of return on produced assets is required in order to estimate the user cost of the produced assets that are utilized in the extraction of the environmental asset. If this cost is not deducted, the resulting estimates of resource rates will be overstated.
Two approaches can be used to estimate rates of return on produced assets: endogenous and exogenous. The endogenous approach sets a rate equal to the net operating surplus (gross operating surplus less consumption of fixed capital) divided by the value of the stock of produced assets. This approach implicitly assumes that there is no return attributable to non-produced assets, including environmental assets, and it is therefore not recommended. It should, however, be used to obtain an upper bound of the estimated rate of return on produced assets.
The exogenous approach is recommended for calculations in the SEEA. It assumes that the expected rate of return of produced assets is equal to an exogenous (external) rate of return. Ideally, the expected rate of return should relate to activity-specific returns, thus taking into account the risks of investing in particular activities.
However, in many cases, financial markets may not be sufficiently developed to provide robust estimates of these specific rates of return. Therefore, the most realistic result can be obtained by an approach that uses the rate of return across the economy, possibly based on the rates on government treasury bonds, if any. 55 In all cases, a real rate of return should be used. While exogenous (external) rates of return are unlikely to be perfect proxies for rates of return on individual produced assets, it is likely that they provide a reasonable reflection of standard return for the derivation of value estimates of an environmental asset.
Choice of discount rate
In order to convert the expected stream of resource rent into a current-period estimate of the overall value, we need to use a discount rate, which expresses a time preference – the preference of the owner of the asset to receive income now rather than in the future. It also reflects the owner’s attitude to risk. In general, individuals and enterprises have higher rates of time preference than society; that is, individuals and enterprises tend to demand a quicker return from ownership of an asset than society as a whole. Higher levels of time preferences translate into higher discount rates.
The discount rate can be interpreted as an expected rate of return on non-produced assets. At an enterprise where all assets are identified and measured accurately and where conditions of perfect competition prevail, the discount rate and the rate of return should be equal. This is because the enterprise should only make investments if the rate of return on all assets is aligned to the time and risk preferences of the enterprise for receiving income.
To ensure a valuation that is aligned to the general concept of market prices, it is recommended that market-based discount rates be used, which are equal to the assumed rate of return on produced assets. However, the use of social discount rates in the valuation of environmental assets also has its supporters. The rationale is that environmental assets have broad and long-term value for society as a whole and should be valued in that light rather than solely in relation to their value to a present-day extractor.
One of the main arguments in favor of social discount rates is that they are generally lower than market-based discount rates and lower rates will place higher relative importance on income earned by future generations. That is to say, estimates that use market-based discount rates are believed to undervalue the interests of future generations, and the total values obtained are too small, since they do not give sufficient weight to these future incomes.
Calculation of net present value
Estimates of the value of an environmental asset are obtained by the following procedure:
a) obtaining estimates of gross operating surplus, specific subsidies and taxes on extraction, and the user cost of produced assets mobilized for the extractive activity (from relevant sources), and making assumptions about rates of return on produced assets;
b) estimation of resource rent as gross operating surplus less specific subsidies plus specific taxes less the user costs of produced assets;
c) estimation of asset life based on physical assessment of stock and projected rates of extraction and growth;
d) forecast of resource rent over the life of the asset, taking account of any expected changes in the extraction schedule;
e) applying the NPV formula to value the environmental asset using an appropriate discount rate.
If, after adjusting for specific taxes and subsidies, the derived expected rent is negative, then the value of the asset should be assumed to be zero. This conclusion should not be based on single observations of negative resource rents but should take account of the likely future patterns of operating surplus and specific taxes and subsidies. In some cases, extraction may continue because the level of specific subsidies is sufficient to ensure a suitable income for the extractor. However, in these situations, the income should not be linked to the underlying environmental asset but, instead, should be considered as a redistribution of incomes within the economy.
If the use of environmental assets does not involve market transactions, direct or indirect non-market valuation should be applied.
SPECIFIC FEATURES IN THE APPLICATION OF SEEA APPROACHES IN RUSSIA
Implementation of SEEA approaches in Russia is based on existing practice in the use of these approaches and the potential for collecting data and deriving estimates of the status and use of environmental resources for environmental-economic accounting purposes. The proposed analysis of how environmental statistics are supported by information resources has been carried out by correlating the available relevant information flows with the environmental-economic accounting methods, both in general terms and in respect of specific resources.
This is followed by a presentation of the results of studies regarding the specifics of SEEA application in Russia to derive indicators for:
- environmental asset accounts for water resources, mineral and energy resources and non-cultivated biological (forest and animal) resources;
- physical flow accounts for air emissions, discharges to water resources and solid waste disposal;
- functional accounts for other environment-related transactions (economic activity for environmental purposes).
Environmental statistics emerged as a separate branch of study in the Russian Federation in the early 1970s. Since then considerable work has been carried out to develop statistical instruments, methodology, and regulatory information; a large volume of data on environmental protection and resource use has been accumulated, including information on the supply and use of natural resources (water, timber, mineral and energy resources, land resources, hunting and aquatic resources), on special protected areas, pollution, environmental protection costs, fees for negative impact, violation of laws on the environment, etc.
The collection and aggregation of data about environmental protection and resource use is carried out at different levels (federal, sub-federal, regional and local) and is in the competence of federal executive authorities: the Ministry of Natural Resources and Environment (Federal Agency for Forestry (Rosleskhoz), Federal Agency for Subsoil Use (Rosnedra), Federal Agency for Water Resources (Rosvodresursy), Federal Service for Supervision of Natural Resources and Human Welfare (Rosprirodnadzor)); the Federal Service for National Statistics (Rosstat); the Ministry of Economic Development (Federal Service for State Registration, Cadaster and Cartography); the Federal Tax Service; executive authorities in the constituent regions of Russia, etc. The leading role is played by Rosstat.56 Primary statistics are collected according to the forms of federal statistical monitoring; uniform requirements are in place for filing primary statistics and administrative data 57 as well as uniform requirements for the execution of statistical reports.
Mandatory statistical accounting is carried out under the federal plan developed by Rosstat together with the reporting entities and adopted by the Government of the Russian Federation.58 The federal plan contains lists of reporting entities and their responsibilities, which include: compiling official statistical information indicating the regularity of each task; the aggregation level of the official statistics (across the Russian Federation, at sub-federal and regional levels, and at local level); categorization of the data; and deadlines for its presentation (distribution) to users. Federal statistical monitoring is carried out in respect of the following respondents:
1) legal entities established in the Russian Federation (including small and medium entrepreneurs); government bodies and local self-government bodies; subsidiaries, affiliates and divisions of foreign organizations operating in the Russian Federation;
2) unincorporated businesses in the Russian Federation.
The body of information resources currently held in the Russian Federation and accepted for purposes of analysis includes primary official statistical data, administrative data and data from other available sources (Table 2.1).
Table 2.1 Sources of information to be used in environmental-economic accounting
|
Information status |
Description of information |
Information sources |
|
Official statistical information |
Aggregated documented information on the quantitative features of large-scale social, economic, environmental and other processes in the Russia, compiled by the reporting entities using official statistical methodology. |
Forms of federal statistical monitoring |
|
Administrative data |
Documented information used in compilation of the official statistics received by the Russian federal public authorities, sub-federal public authorities, local government authorities and organizations in the course of their licensing, registration, supervision, control and other administrative functions. |
Administrative information of the Russian Ministry of Natural Resources and Environment, Federal Forestry Agency, Russian regional executive authorities, etc. |
|
Other available sources of information |
Estimates (quantitative, qualitative) drawing on professional experience, and research studies of processes and phenomena that are not reflected in the systems or are not accounted for by direct, exact measurement |
Expert opinions, scientific research, publications |
Source: Federal Law of November 282, 2007, No. 23.07.2013-FZ (as amended on July 23, 2013), “On Official Statistical Reporting and the State Statistics System in the Russian Federation.”
Below are presented the results of studies of practical aggregation of primary statistics, administrative information and other available data, which have been carried out in order to apply the approaches of the SEEA Central Framework for deriving estimates to be used in:
- environmental asset accounts for water resources, mineral and energy resources and non-cultivated biological resources (forest and animals);
- physical flow accounts for air emissions, discharges into water bodies and solid waste disposal;
- functional accounts for other transactions related to the environment (economic activity for conservation purposes).
Environmental asset accounts are designed to record the opening and closing stock of environmental assets, primarily to assess whether current patterns of economic activity are depleting and degrading the available environmental assets. These accounts provide information for efficient management of environmental assets.
Water resources
Data on the status and changes in the stock of water resources as well as their use in economic activities is contained in the State Water Register and in the forms of federal statistical monitoring. This information is collected by Rosstat, Rosvodresursy, the Federal Service for the Protection of Consumer Rights (Rospotrebnadzor) and the Federal Tax Service (Table 2.2).
Table 2.2 Main sources of information on the status and changes in the stock of water resources
|
Name of the form |
Name of the Federal Agency |
Respondents* |
|
No.1-enterprise “General information on the activities of the organization” |
Federal Service for National Statistics |
Legal entities (excluding small businesses, state-funded organizations, banks, insurance and other financial and lending organizations) |
|
No.1-water supply “Information on water supply (the self-contained water supply network)” |
Federal Service for National Statistics |
Local government authorities, legal entities delivering water to public or state-funded organizations (including organizations that lease facilities for the provision of services) |
|
No.1-sewerage “Information on sewerage (the self-contained sewerage network)” |
Federal Service for National Statistics |
Local government authorities, legal entities engaged in wastewater management for public or state-funded organizations (including organizations that lease facilities for service provision) |
|
4-os “Information on environmental protection expenditures and environmental fees” |
Federal Service for National Statistics |
Legal entities, unincorporated businesses (sole traders) engaged in environmental work, and paying for negative impact on the environment. |
|
18-ks “Information on investments in fixed capital for environmental protection and resource use” |
Federal Service for National Statistics |
Legal entities (excluding small and micro-businesses) engaged in all kinds of economic activity. |
|
2-tp (water management) “Information on the use of water” |
Federal Agency for Water Resources |
Legal entities, unincorporated businesses (sole traders) managing water supply facilities or using water from water supply systems |
|
State Water Register |
The Register is maintained by the Federal Agency for Water Resources. |
Information is provided free of charge by the Russian Ministry of Agriculture, Rosprirodnadzor, the Federal Agency for Maritime and River Transport, the Federal Service for Hydrometeorology and Environmental Monitoring (Roshydromet), sub-federal executive authorities, local government, etc. |
|
No. 18 “Information on sanitary conditions in the Russian constituent entity” |
Rospotrebnadzor |
Federal state-funded health care organizations (Centers for Hygiene and Epidemiology in Russian constituent entities, for railway transport, a similar center at Rospotrebnadzor); Rospotrebnadzor Directorates in Russian constituent entities and for railway transport; The Federal Medical and Biological Agency; departments of the Russian Defense Ministry, Ministry of Internal Affairs, Federal Security Service, etc. |
|
1-NM “Report on assessment and receipt of taxes, duties and other statutory charges to the Russian budget” |
Federal Tax Service |
Federal Tax Service Directorates in Russian constituent entities |
*Rosstat Order of August 12, 2013, No. 323, “On Approval of Statistical Instruments for Federal Statistical Monitoring of Business Activities.”
*Rosstat Order of August 3, 2011, No. 343 (as amended on April 1, 2014), “On Approval of Statistical Instruments for Federal Statistical Monitoring of Construction, Investments in Non-Financial Assets and Utilities”
Rosstat Order of August 06, 2013, No.309 (as amended on April 1, 2014 and August 29, 2014), “On Approval of Statistical Instruments for Federal Statistical Monitoring of Agriculture and the Environment.”
Rosstat Order of October 19, 2009, No.230 (as amended on November 28, 20114), “On Approval of Statistical Instruments for Engaging Rosvodresursy in Federal Statistical Monitoring of Water Use.”
Regulation of the Russian Government of April 28, 2007, No.253 (as amended on April 18, 2014), “On the Procedure for Maintaining the State Water Register.”
Rosstat Order of October 16, 2013, No.411, “On Approval of Statistical Instruments for Engaging the Federal Service for Consumer Rights Protection and Human Welfare in Statistical Monitoring of the Sanitary Condition of Territories, Occupational Diseases (Toxic Poisoning), and Exposure to Radiation.”
Order issued by the Russian Federal tax Service dated December 13, 2012, No.MMB-7-1/951, “On Approval of Statistical Tax Reporting Forms of the Federal Tax Service for 2013.”
The State Water Register is a structured assembly of documented information on water bodies owned by the federal government, sub-federal, regional and local governments, individuals and legal entities, with a description of their use; and also on river basins and watershed districts. The State Water Register registers water use contracts, decisions on water body entitlements, transfer of water body ownership rights and liabilities under water use contracts, and termination of water use contracts. Collection and safekeeping of documented information on underground water bodies is provided pursuant to legislation on subsoil resources.
The Register is created and maintained to enable coordinated use of water bodies, their purposeful exploitation and protection, and for planning and designing measures to prevent negative impact due to water and to manage the consequences of such negative impact. The Register is maintained by the Federal Agency for Water Resources. The Register includes three sections: Water Bodies and Water Resources, Water Use and Water Body Infrastructure. The Water Bodies and Water Resources section contains information concerning watershed districts and water bodies located within watershed districts, including information on the features of water use schedules, their physical, geographical, morphometric and other properties.
The Water Use section provides information on: water management districts; water protection areas and protected shoreline belts, wetland areas and flooding; use of water bodies, including data on water consumption and wastewater discharge; decisions on provision of water rights; permits for dumping of material produced by dredging operations in inland sea areas and offshore territorial waters of the Russian Federation, etc.
The Water Body Infrastructure section contains information on water management systems and on hydro-technical and other installations located in and around water bodies 59. The format of the State Water Register is approved by the Order of the Russian Ministry of Natural Resources (May 29, 2007, No.138). The procedure and the composition of data to be provided by executive bodies are established by the respective regulations of the Ministry of Natural Resources 60.
Use of water resources is subject to payment. Water tax is paid 61 by organizations and individuals who use water for specific purposes in accordance with the laws of the Russian Federation. The following types of use of water bodies are taxable:
1) uptake of water from water bodies;
2) use of water bodies, except for timber floating and loose rafting;
3) use of water bodies for water uptake to the hydropower industry;
4) use of water bodies for timber floating and loose rafting.
The tax period is a quarter. Tax rates are established for river basins, lake basins and sea basins and for economic districts by each type of taxable water use.
Analysis of the reporting forms of the State Water Register and federal statistical monitoring to assess their efficiency in reflecting supply and use of water resources has shown that the existing reporting forms contain a considerable number of estimates characterizing water resources, with their subdivision into surface water and ground water. The available data show the annual discharge module, average water consumption, water use in the economy for drinking and production needs, for regular irrigation and agricultural water supply, transportation losses, wastewater discharge flows (untreated, insufficiently treated, adequately treated), content of pollutants in wastewater as well as the sanitary condition of water bodies and sources of drinking water. Many forms of the State Water Register contain information on watershed districts and river basins, observation stations in and around water bodies, and hydrographic features, which show the level of knowledge of water resources and provide important inputs for their evaluation. Most of the data are physical in nature. Monetary estimates include: operating costs of wastewater collection and treatment; capital investments in protection and use of water resources; costs of fixed asset overhaul for water protection purposes; fees for permissible and excessive discharge of pollutants into water bodies; water tax, etc.
The greater part of information on water reserves, water uptake and wastewater discharge as well as losses and content of pollutants in wastewater is obtained and analyzed by the Federal Agency for Water Resources. Information on operating and investment expenditures for protection and use of water resources is collected by Rosstat, while data on the sanitary condition of water bodies is the concern of Rospotrebnadzor. Because there are a number of different information flows regarding water resources in the Russian Federation, a mechanism is needed for data transfer and improvement of the linkage between the government structures, which compile sets of estimates for water resources at federal and regional levels.
Information on the state and use of water resources is, for the most part, publicly available and is published by the relevant executive bodies in hard copy and in electronic form. The data of the State Water Register are open, except for information regarded by Russian law as classified. The Federal Agency for Water Resources must provide information from the State Water Register within five days in response to an inquiry from a concerned party. Copies of requested documents are provided in return for a fee set by the Government of the Russian Federation.62
The information flows currently available are of a complex nature, frequently duplicating each other by fully or partially repeating estimates in different forms of reporting. For example, the entry “Total annual use” concerning types of water use, can be found in a reporting form 2.10 “Water body use. Uptake of water from water bodies” (Federal Agency for Water Resources) and in Form 2-tp (water management) “Information on water use.” A similar situation is observed with estimates such as “transportation losses,” “wastewater discharged,” “contents of pollutants in wastewater.” This may lead to discrepancies between data referring to the same estimates, from either objective or subjective causes. This should be taken into account when choosing estimates and advising on the technique of their derivation.
Monetary estimates of water resources using tariffs governed by current special taxes/charges for water use can, in general, be based on the existing information flows, which are controlled by the Russian Finance Ministry and Federal Tax Service (with respect to water tax). It should be mentioned that, in both cases, not only do the available data reflect uptake of water but they also provide materials describing fiscal flows for water use without an uptake of water from the environment, i.e., from water bodies. However, the figures obtained from these calculations will be significantly understated in comparison with the actual processes and phenomena. This is due to numerous fiscal allowances and tariff preferences granted to a wide range of activities of water users/water use elements. All these allowances and tariff preferences result in incomplete deduction of the water resource rent (i.e., leaving it with various water users), which in turn hinders adequate (full) estimation of this rent. It should also be noted that the aggregates obtained are becoming less complete. This can be seen on the example of reporting information concerning water use (Table 2.3).
Table 2.3 Changes in the number of water users subject to statistical monitoring according to Form No.2-tp (water management) “Information on water use”:
|
Estimates |
2005 |
2009 |
2010 |
2011 |
2012 |
2013 |
|
Number of water users (thousand units) |
45.8 |
39.2 |
31.3 |
30.0 |
29.4 |
29.0 |
|
% to 2005 |
100 |
86 |
68 |
66 |
64 |
63 |
|
including “Agriculture, hunting and related services,” total (thousand units) |
17.9 |
11.5 |
… |
6.3 |
6.0 |
5.75 |
|
% to 2005 |
100 |
64 |
… |
35 |
34 |
32 |
As it is apparent from Table 2.3, the number of water users who provide reporting decreased by nearly a third over eight years (from 2005 to 2013). In agriculture, this figure fell by two-thirds. This is probably the result of actual reduction in the number of water users and hence, of water use as such, but it is also caused by organizational factors, including relaxation of discipline in accounting.
On the whole, the information base contains a range of estimates that are required for the standard SEEA for water resources as regards surface water (consistent with par. 1.15 SEEA-W – System of Environmental-Economic Accounting for Water, 2012). It includes such indicators as the use of water resources as an input for production, water reuse in economy, pressure exerted by the economy on the environment (water uptake and pollutant discharge), cost of wastewater collection and treatment, etc.
Mineral and energy resources
Information on the current state and changes in the stock of mineral and energy resources as well as their use in economic activity is collected and analyzed by Rosstat, the Ministry of Natural Resources and other federal executive authorities (Table 2.4).
Table 2.4 Main sources of information on the state and changes in the stock of mineral and energy resources
|
Reporting form |
Federal agency |
Respondents |
Reporting regularity |
|
1-fuel and energy industry (crude oil) “Information on oil well operation” |
Federal Service for National Statistics |
Legal entities (excluding small businesses) engaged in oil, associated gas and gas condensate extraction |
on an annual basis |
|
2-fuel and energy industry (gas) “Information on gas well operation” |
Federal Service for National Statistics |
Legal entities (excluding small businesses) with gas wells on their balance sheet |
on an annual basis |
|
6-oil “Information on oil extraction and production cost of petroleum products” |
Federal Service for National Statistics |
Legal entities (excluding small businesses) engaged in oil extraction and/or refining |
on quarterly basis |
|
No.1-enterprise “General information on activities of the organization” |
Federal Service for National Statistics |
Legal entities (excluding small businesses, state-funded organizations, banks, insurance and other financial and lending organizations) |
on an annual basis |
|
5-z “Information on the cost of production and sale of products (goods, work, services)” |
Federal Service for National Statistics |
Legal entities of all forms that are commercial and non-commercial organizations engaged in the production of goods and services for sale to third parties (except for small businesses, which use the simplified taxation scheme, state-funded organizations, banks, insurance and other financial and lending organizations) |
on quarterly basis |
|
P-1 “Information on production and shipping of goods and services” |
Federal Service for National Statistics |
Legal entities (excluding small businesses) employing over 15 people on average (including part-time workers and independent contractors) |
on a monthly basis |
|
P-3 “Information on financial standing of the organization” |
Federal Service for National Statistics |
Legal entities (excluding small businesses, state-funded organizations, banks, insurance and other financial and lending organizations) employing over 15 people on average (including part-time workers and independent contractors) |
on a monthly basis |
|
01-gr “Information on geological prospecting and exploration” |
Federal Service for National Statistics |
Legal entities engaged in geological prospecting and exploration |
on an annual basis |
|
P-2 (brief) “Information on investments in gross fixed capital” |
Federal Service for National Statistics |
Legal entities (excluding small businesses and enterprises employing fewer than 15 people, which are not small businesses) and their separate divisions |
on a monthly basis |
|
5-gr “Information on the state and changes in the stock of solid mineral deposits” |
Russian Ministry of Natural Resources (Rosnedra) |
Legal entities and their divisions, which are subsoil users engaged in prospecting and exploration of deposits in the unallocated subsoil reserve fund |
on an annual basis |
|
6-gr “Information on the status and changes in the stocks of oil, gas, condensate, ethane, propane, butane, sulfur, nitrogen, carbon dioxide, vanadium and nickel admixtures in oil” |
Russian Ministry of Natural Resources (Rosnedra) |
Entrepreneurs, including members of partnerships, legal entities engaged in subsoil study, prospecting and assessment of deposits, exploration and extraction of mineral resources (by categories of subsoil use) |
on an annual basis |
|
70-tp “Information on recovery of mineral resources in the process of extraction” |
Russian Ministry of Natural Resources (Federal Subsoil Resource Management Agency (Rosnedra)) |
Legal entities and their divisions, which are subsoil users engaged in extraction of solid minerals (by subsoil areas) |
on an annual basis |
|
1-NM “Report on assessment and receipt of taxes, duties and other statutory payments to the Russian budget” |
Federal Tax Service |
Federal Tax Service Directorates in Russian constituent entities |
on a monthly basis |
The state cadaster of deposits and mineral occurrences is an important source of information. The cadaster is maintained in order to support the development of federal and regional geological prospecting programs, comprehensive use of mineral deposits, allocation of extracting enterprises, etc.63 The cadaster contains information on every deposit, describing the quantity and quality of the principal and co-occurring minerals, mining, technical, hydro-geological, environmental and other conditions for development of the deposit, its geological and economical evaluation as well as information on the discovered occurrences of minerals.
For the purpose of accounting of available mineral resources, a balance sheet of mineral reserves is maintained as a part of national accounts, containing information on the quantity, quality and degree of geological certainty of the stock of every kind of commercially relevant mineral by deposit, location, degree of development, extraction, losses, etc.64 The national balance sheet is compiled and maintained by the Federal Agency for Subsoil Use The balance sheet presents data on changes in the recoverable and currently unrecoverable stock of mineral resources over an accounting period due to: extraction operations; subsoil extraction losses for solid minerals; oil, gas and condensate extraction losses; additions or reductions in the course of exploration work; revaluations due to revision of the parameters used for reserve calculation; loss of economic value for technological or geological reasons; non-confirmation of reserves in the process of development or subsequent exploration; license reissue, etc.65 The national balance sheet of mineral resources is of principal importance in assessment of the current state and prospects for industry development.
The national cadaster of mineral deposits and occurrences and the national balance sheet of mineral resources are compiled on the basis of geological information presented to federal and territorial geological information funds by enterprises engaged in geological studies, and also on the basis of reports submitted by enterprises engaged in exploration and extraction.
The stocks of mineral resources and commercial minerals contained therein, which are subject to government accounting, are divided into two main groups:
- recoverable (economically viable) reserves These include reserves whose development is cost-effective in the competitive market at the time of technical and economic evaluation, provided that extraction and processing methods and technology are used, which comply with provisions for subsoil use and environmental protection.
- unrecoverable (currently not economically viable, potential) reserves, which must be separately accounted for. They include:
1) reserves whose development at the time of technical and economic evaluation is not cost-effective (loss-making) in the competitive market due to low technical and economic characteristics, but which may be profitable when prices of minerals change, an appropriate market emerges or a new technology is developed;
2) reserves that meet the requirements of in-place reserves but whose development is impossible at the time of the evaluation because they are situated within protected water areas, residential areas, industrial or farming facilities, nature reserves, or in the vicinity of natural, historical and cultural monuments.66
The analysis of reporting forms as to their efficiency in reflecting the supply and use of mineral resources has shown that the existing reporting forms contain many estimates regarding the supply and use of mineral and energy resources. The estimates refer to different types of mineral resources: raw hydrocarbons, solid minerals and other fossil mineral resources (ethane, propane, butane, sulfur, nitrogen, carbon dioxide, etc.). The estimates are presented in physical and monetary terms. The physical estimates present information on the stock of mineral resources (recoverable and currently unrecoverable), changes of in-place resources due to extraction, losses sustained in extraction, exploration, revaluation, writing off of non-confirmed reserves, changes in technological boundaries or for other reasons, changes in the scope of geological exploration, etc. The available information flows can be used for environmental-economic accounting in order to derive estimates in physical terms.
The monetary estimates include, primarily, taxes on extraction of raw hydrocarbons, taxes on extraction of commonly occurring mineral resources, taxes on extraction of natural diamonds and other mineral resources. In addition, there are monetary measures of the full cost of oil extraction, budgeted costs of exploration, capital investments in subsoil exploration and evaluation of mineral resources, etc., which can be used for deriving estimates of mineral and energy resources in monetary terms.
It should be noted that the greater part of information on reserves (recoverable and unrecoverable) of solid mineral resources, oil, gas, condensate, ethane, propane, butane, and on changes in these reserves due to extraction, losses sustained in extraction, exploration, revaluation and for other reasons, is assembled by Rosnedra. Information on taxes on extraction of mineral resources is processed by the Federal Tax Service while the full oil extraction cost is derived by Rosstat. Because there are a number of different information flows regarding water resources in the Russian Federation, a mechanism is needed for data transfer and improvement of the linkage between the government structures, which compile sets of estimates for water resources at federal and regional levels.
Geological data on subsoil resources held by the government are divided into public domain information and restricted information. The restricted information includes data on the amount of recoverable mineral resources in the country. Pursuant to Art. 16 and 17 of the Law of the Russian Federation, “On State Secrets,” information constituting a state secret can only be disclosed with the permission of the government body holding this information. 67
Overall, the information base contains a large number of estimates that are required for environmental-economic accounting of mineral and energy resources.
Non-cultivated biological resources (forests and animals)
The analysis of information flows referring to the status and use of non-cultivated biological resources (forests and animals) has been carried out with respect to resources that, according to the SNA 2008, meet the definition of economic resources: timber, non-timber forest products (soft resin, non-timber forest resources, forest food resources, medicinal plants); game resources (hoofed animals, fur animals, bears, birds). Data on the above-mentioned resource categories are collected by Rosstat, the Russian Ministry of Natural Resources and executive bodies of Russia’s constituent entities (Table 2.5)
Table 2.5 Main sources of information on the status and changes in the stock of non-cultivated biological resources (forest and animals)
|
Reporting form |
Federal agency |
Respondents |
|
|
Reporting regularity1-Rosleskhoz Information on forest regeneration and afforestation |
Federal Service for National Statistics |
Legal entities, unincorporated businesses (sole traders) engaged in forest regeneration and afforestation on the territory of the forest fund and other land categories. |
on an annual basis |
|
12-Rosleskhoz, “Information on forest protection” |
Federal Service for National Statistics |
Legal entities, unincorporated businesses (sole traders) engaged in pest control in areas of the forest fund and other land categories. |
on an annual basis |
|
1-Rosleskhoz (Chernobyl), “Information on forest regeneration and afforestation in areas of nuclear contamination” |
Federal Service for National Statistics |
Legal entities engaged in forest protection activities on the territory of the forest fund and other land categories in areas of nuclear contamination of forest resources |
on an annual basis |
|
2-tp (hunting) Information on Game Management |
Federal Service for National Statistics |
Legal entities, unincorporated businesses (sole traders), which are parties to game use agreements or hold long-term licenses to use game resources |
on an annual basis |
|
4-os “Information on environmental protection expenditure and environmental fees” |
Federal Service for National Statistics |
Legal entities, unincorporated businesses (sole traders) engaged in environmental activities and/or paying fees for negative impact on environment |
on an annual basis |
|
18-ks “Information on capital investments in environmental protection and resource use” |
Federal Service for National Statistics |
Legal entities (excluding small businesses) engaged in all kinds of economic activity |
on an annual basis |
|
State Forest Register |
The Forest Register is maintained by sub-federal government authorities with respect to forests located in the respective regions. Rosleskhoz aggregates the information. |
Documented information must be submitted by: 1) persons engaged in the use, conservation, protection and regeneration of forests; 2) government authorities managing the use, conservation, protection and regeneration of forests |
on an annual basis, except for Forms 2.3 State Forest Register 2.4 State Forest Register 3.1 State Forest Register 3.5 State Forest Register 3.6 State Forest Register 3.7 State Forest Register 4.4 State Forest Register, which must be filed on a quarterly basis |
|
State Register of Game Use |
The Register is maintained by the executive authority of a Russian constituent entity, submitting information to the Ministry of Natural Resources. |
Documented information with regard to hunting areas in use must be filed annually by legal entities and sole traders engaged in hunting |
on an annual basis |
|
Reporting forms of sub-federal government authorities on exercise of their delegated powers in respect of forestry |
Rosleskhoz (data collection, processing and analysis) |
Sub-federal government authorities exercising delegated powers in respect of forestry |
on a quarterly basis, except for Forms 8-OIP and 11-OIP (annually), 10-OIP (semiannually), 17-OIP (monthly) |
|
Reporting forms of sub-federal government authorities on exercise of delegated powers in respect of hunting and game resource preservation |
Federal Service for Environmental Control (sections 1-6), Russian Ministry of Natural Resources and Environment (Table 7) |
Sub-federal government authorities exercising delegated powers in respect of game resource preservation |
on quarterly basis |
Timber resources Statistical units are:
- legal entities, unincorporated businesses (sole traders) engaged in forest pest control on the territory of the forest fund and other land categories (information collected by Rosstat)
- sub-federal government authorities exercising delegated powers in respect of forestry relations (information collected by Rosleskhoz);
- individuals, legal entities engaged in forest use, regeneration and/or afforestation (information collected by government and local government authorities entitled to exercise powers in respect of forest management).
Principal information on forest resources, their use, protection and regeneration is contained in the reporting forms of the State Forest Register. In addition, certain data are contained in forms of federal statistical monitoring, e.g., in respect of regeneration and afforestation, operating costs and capital investments in environmental protection and natural resource use. Data are also contained in the reporting forms of government authorities exercising delegated powers in respect of forestry. According to the federal plan for statistical monitoring, Rosleskhoz derives information on forests, forest fires, forest conservation, protection, use, regeneration, the use of subsidies from the federal budget for exercising certain powers of the Russian Federation in respect of forestry, actual expenditures from all sources of financing in present prices, etc.
The State Forest Register is a structured corpus of documented information on: the composition of the forest fund and other categories of land that contains forests; forest districts, urban forests and their subdivisions; protective forests and their categories; exploitable and reserve forests; special protected forest areas, areas of special use; quantitative, qualitative and economic characteristics of forests and forest resources; forest use, conservation, protection and regeneration, including seed breeding; entitlement to use of forest areas68 . The State Forest Register is maintained by the Federal Agency for Forestry (Rosleskhoz), using the established forms69 ; they can be updated by government authorities and by local forest management authorities within the limits of their statutory power70 .
The documented information contained in the State Forest Register is open, except for restricted information as established by federal laws (restricted information). Information is provided in the form of excerpts upon written request filed by any person with the authorized government body or through public telecommunication networks, including the Russian Public Services Portal, or by other communication technology. The information is providing by giving access to the information resource containing the data of the State Forest Register71. Excerpts from the State Forest Register are provided in return for a payment.
Individuals, including sole traders and legal entities, provide government authorities and local government bodies with the following information:
- report on forest use (on a monthly basis) including actual scope of the use, as a cumulative total from the beginning of the year to the end of the accounting period72 ;
- report on forest conservation and protection activities (on a quarterly basis) including the actual scope of conservation and protection measures, as a cumulative total from the beginning of the year to the end of the accounting period73 ;
- report on forest regeneration and afforestation (on a quarterly basis) providing information on actual measures for forest regeneration and afforestation, as a cumulative total from the beginning of the year to the end of the accounting period74 .
The analysis of the forms of federal statistical monitoring, the State Forest Register and reports of government authorities on exercise of the powers delegated to them in respect to forestry as regards maintenance of indicators on the status and use of forest resources (timber and non-timber forest products) has shown that the above documents contain estimates of the stock of forest resources (areas where forests are located, allocation of timber stock by prevailing species and age group, certain qualitative characteristics of forests, e.g., contamination density, etc.), on the economic use of forests (calculated felling rate by type of activity and designated purpose, use of forests by individuals and legal entities, e.g., harvesting of soft resin, non-timber forest resources, medicinal plants, etc., actual volume of timber harvested, etc.), on forest conservation and protection (information on forest fires, forest stock perished as a result of fires, damage incurred from insects and wild animals, human factors, measures taken for forest protection and conservation, etc.), and forest regeneration.
The estimates are mainly physical in nature. Some estimates on the use of forest resources are presented in square measures (hectare), e.g., forest mortality by type of causes, growth of forest fruits, berries, medicinal plants, ornamental plants, etc. This impedes use of the data for evaluating forest resources in physical terms and at present market value as established by the SNA/SEEA approaches. Only approximate calculations and rough estimates are possible in this case, for purposes of including the required figures in reporting forms. Estimates presented in monetary terms include: operating costs of forest regeneration and afforestation measures, forest protection work, capital investments in protection and use of forest resources, auction starting price, auction closing price, returns on the use of forests, etc.
It should also be noted that pursuant to Art. 6 of the Russian Forest Code, forests are located in areas pertaining to the forest fund and in other land categories (areas designated for defense and security purposes, residential areas and special protected natural areas). The forms of forestry reporting developed by Rosleskhoz require information to be collected mainly in areas pertaining to the forest fund. The 1-Rosleskhoz and 12-Rosleskhoz forms of federal statistical monitoring collect and process data for all categories of land, and most of the estimates are impossible to differentiate. So problems arise in respect of data correlation due to differences in the classification and range of reporting entities subject to federal statistical monitoring and industry reporting.
At the regional level, information on forest resources may also be presented in respective forest management plans. For example, the Governor of Yaroslavl Region approved the forest management plan for Yaroslavl Region (dated June 29, 2011, No.284), which contains information on the forest condition, designated purpose by forest districts and parks, on the forest structure by species and age group, on the main purposes of use of forest resources and their regeneration, as well as data regarding returns on forest use and expenditures on performance of the forest management plan. The standard form and composition of a regional forest management plan were approved by Order No.423 issued by Rosleskhoz, dated October 5, 2011. This document was prepared on the basis of forest management materials, forest stock-taking, the State Forest Register, reports on forest use, conservation, protection and regeneration, plans for social and economic development and other regional planning documents. Regional forest management plans are prepared for a 10-year period.
Game Resources Principal information on game resources is contained in the State Hunting Register, in reporting forms of federal statistical monitoring and in the reports of sub-federal government authorities on exercise of delegated powers in respect of hunting and game resource conservation. The State Hunting Register contains documented information on the following:
1) quantitative, qualitative and economic characteristics of game resources;
2) types, location, boundaries, ownership and condition of hunting districts;
3) legal entities and sole traders engaged in hunting and organizations engaged in the procurement, production and sale of hunting products;
4) use and conservation of game resources;
5) hunting services;
6) hunters, etc.75
The State Hunting Register is maintained in a standard format and in accordance with the established procedure for information collection and safekeeping, ensuring its provision to interested parties76 in accordance with the principles of technological uniformity across the Russian Federation, public accessibility and regular updating, and correlation with data contained in other government information resources. The Register information is publicly available and is provided upon request. The Hunting Register is maintained by regional government bodies with subsequent submission of the data to the authorized federal government body. The Register is composed of 8 sections enabling systematization of the data.
The contents, reporting forms and the procedure for reporting on the exercise of powers delegated by the Russian Federation in respect to hunting and conservation of game resources were approved by the Order of the Russian Ministry of Natural Resources, dated January 28, 2011, No.23.
The analysis of the reporting forms of federal statistical monitoring, the State Hunting Register and reports of government authorities on the exercise of delegated powers in respect of hunting and game resource conservation for evaluation of the status and use of game resources has shown that government accounting, cadaster and monitoring of rare and endangered wildlife are kept in the Red Books of the Russian Federation and its constituent entities77 . The physical estimates present information on the stock (population) of game resources (birds, mammals), on the use (extraction) of game resources (hoofed animals, fur animals, birds, wolves, bears) and on animal mortality caused by various factors (disease, road accidents, illegal hunting, etc.). The monetary estimates show costs incurred by different subgroups of the hunting sector, earnings from the sale of hunting products and services, cost of services provided in the hunting sphere, auction starting and closing prices, etc.
In this way, data relating to timber resources and game resources are collected and processed by Rosstat and other federal executive bodies, particularly the Ministry of Natural Resources and Environment and its agencies, as well as by sub-federal government bodies. The fact that there are a number of different information flows makes it important to establish an efficient mechanism for communicating data and to improve the links between government institutions compiling sets of estimates referring to timber resources and game resources at federal and regional levels. Information on the state and use of non-cultivated biological resources is open and is published by the relevant government bodies in hard copy and electronically.
At the present time, the above-mentioned flows and sets of information are of a complex and multi-layered character, having elements of duplication, full and/or partial repetition of indicators in different reports referring to timber resources. For example, estimates of forest regeneration are recorded in form 1-Rosleskhoz, “Information on forest regeneration and afforestation” (Rosstat) and in form 4.3 State Forest Register, “Forest regeneration measures envisaged and carried out under the regional forest management plan and forestry regulations” (Rosleskhoz). For objective or subjective reasons, this may lead to discrepancies between data referring to the same estimates. This fact should be taken into account when choosing specific estimates and underlying data to be used for reflecting information on the status and use of non-cultivated biological resources.
Monetary estimates of timber resources are generally contained in reporting forms on the work of sub-federal government bodies in carrying out functions delegated to them with regard to timber resources. Data referring to game resources are recorded in the state statistical monitoring form 2-TP (hunting), “Information on hunting and hunting management” and in reporting forms on the work of sub-federal government bodies in carrying out functions delegated to them with regard to game resources. Overall, the existing information base contains many estimates required for environmental-economic accounting of timber and game resources.
Environmental pollution consists mainly of pollutant emissions into the atmosphere, wastewater discharges into water bodies and the generation of production and consumer waste (solid waste residuals).
Information on air emissions, discharges to water bodies, solid waste generation and recycling is collected and analyzed by Rosstat, the Ministry of Natural Resources and Rospotrebnadzor (Table 2.6)
Table 2.6 Main sources of information on air emissions, discharges to water bodies, solid waste generation and recycling
|
Reporting form |
Federal agency |
Respondents |
Reporting regularity |
|
2-TP (air) “Information on Air Protection” |
Federal Service for National Statistics |
Legal entities, unincorporated entities (sole traders) operating stationary sources of air pollution |
on an annual basis |
|
1-KH “Information on Urban Improvement” |
Federal Service for National Statistics |
Local government, legal entities: multisectoral production utilities, utilities and housing enterprises, urban improvement enterprises, landscaping, road and bridge engineering, road maintenance enterprises and directorates |
on an annual basis |
|
2-TP (water management) “Information on the use of water” |
Federal Water Resources Agency |
Legal entities, unincorporated businesses (sole traders) managing water supply facilities or using water from water supply systems |
on an annual basis |
|
The State Water Register |
Federal Water Resources Agency |
Information is provided free of charge by the Russian Ministry of Agriculture, Rosprirodnadzor, Federal Agency for Maritime and River Transport, Federal Service for Hydrometeorology and Environmental Monitoring (Roshydromet), sub-federal executive authorities, local government authorities, etc. |
on an annual basis |
|
2-TP (waste residuals) “Information on generation, use, decontamination, transportation and disposal of production and consumption waste” |
The Federal Supervisory Natural Resources Management Service (Rosprirodnadzor) |
Legal entities, unincorporated businesses (sole traders) engaged in management of production and consumption waste |
on an annual basis |
|
18 “Information on the sanitary situation in the Russian constituent entity” |
Rospotrebnadzor |
Federal state-funded health care organizations (Centers for Hygiene and Epidemiology in Russian Constituent Entities, similar centers for railway transport and at Rospotrebnadzor); Rospotrebnadzor directorates in Russian constituent entities and for railway transport; Federal Medical and Biological Agency; departments of the Russian Defense Ministry, Ministry of Internal Affairs, Federal Security Service, etc. |
on an annual basis |
An important source of information is the state waste cadaster78 , which includes the federal waste classification catalog, state landfill facility register, and the waste and waste recycling technology data bank. It is designed to provide information support to government authorities, local government bodies, legal entities and unincorporated entities dealing with waste in their economic or other activities as well as legal entities and unincorporated entities operating landfill facilities. The information in the state waste cadaster is a government information resource and is open, except for information subject to restricted access under Russian law. It should be noted that the state waste cadaster has a methodological character and does not contain any numerical estimates of waste management activities.
The analysis of reporting forms as regards the recording of information on air emissions, discharges to water bodies and solid waste has shown that they contain a considerable amount of data on negative impact on the environment. With respect to air emissions, the reports provide information on stationary pollution sources, amounts of pollutants captured, recycled and discharged, etc.; account is taken of all pollutants contained in gases discharged by stationary pollution sources owned by economic actors and in air used from human respiration; there are no accounting data on carbon dioxide and ozone emissions. With respect to pollutants, the amount of pollutants in discharged wastewater is recorded. With respect to solid waste residuals, there is information on the generation, use, decontamination, transportation and disposal of production and consumption waste categorized by hazard class and type, etc.
These data are in the public domain and are published in the respective statistical information packages in hard copy and electronically. Estimates of air emissions, discharges to water bodies and treatment of solid residuals are provided without undue repetition and treated unambiguously, which makes it easy to include them in the environmental-economic accounting system. However, the existing reporting system lacks a number of estimates recommended by the SEEA 2012 for account compilation: e.g., air emissions from households, from landfill sites, releases into the ground (leakages from pipelines, chemical spills), waste exports, etc.
Environmental protection consists of the work of government authorities of the Russian Federation, sub-federal governments, local government bodies, legal entities and individuals, social and other non-commercial associations intended for the preservation and regeneration of the natural environment, use and replenishment of natural resources, prevention of negative impact of economic and other activities and management of their consequences. Principal information on expenditures on environmental protection is recorded in the federal statistical monitoring forms 4-OS, “Information on operating costs of environmental protection and environmental fees” and 18-KS, “Information on capital investments in environmental protection and resource use,” which are collected and processed by Rosstat (Table 2.7).
Table 2.7 The main sources of information on environmental expenditures collected and processed by the federal system of statistical monitoring, Rosstat.
|
Reporting form |
Federal agency |
Respondents |
|
|
Reporting regularity4-os “Information on environmental protection expenditure and environmental fees” |
Federal Service for National Statistics |
Legal entities, unincorporated businesses (sole traders) engaged in environmental activities and/or paying fees for negative impact on environment |
on an annual basis |
|
18-KS “Information on capital investments in environmental protection and resource use” |
Federal Service for National Statistics |
Legal entities (excluding small businesses) engaged in all kinds of economic activity |
on an annual basis |
The analysis of forms of statistical monitoring as to what they record regarding expenditures on environmental protection has shown that they record information on various environmental activities (atmospheric air protection, water, timber resource protection and use, subsoil protection and use of mineral resources, protection and regeneration of wildlife, etc.), types of expenditures (operating costs, capital expenditure and investments in environmental protection), and sectors of the economy (manufacturing, including specialized enterprises for environmental services, and the public sector). Various measures and events are referred to the category of environmental activities by the lists given in instructions for the completion of reporting forms for federal statistical monitoring and by the list of environmental activities and services approved by the Order of the Russian Environmental Agency (dated February 23, 2000, No.102). Nevertheless, the existing reporting forms do not give exhaustive and correct information. For example, data referring to expenditures on environmental protection against noise, vibration and other kinds of physical impact are included in operating cost estimates (form 4-OS), but capital investments in this group of activities (form 18-KS) are not accounted for. The absence of a unified approved classification of environmental protection activities in Russia makes it difficult to refer particular expenditures to the category of environmental costs and thus hinders their comprehensive accounting, which is critical for the proper compilation of environmental-economic accounts.
In order to formalize the sources of existing information flows, we will consider the possibilities and methods of collecting relevant input data in the functional spheres of various federal government bodies of the Russian Federation (Fig. 2.1). It should be noted that most of the information required for compiling supply and use tables and asset accounts is accumulated and processed by Rosstat. However, their composition, structure and presentation are oriented to the functional tasks of Rosstat and may not conform to the SEEA approaches.
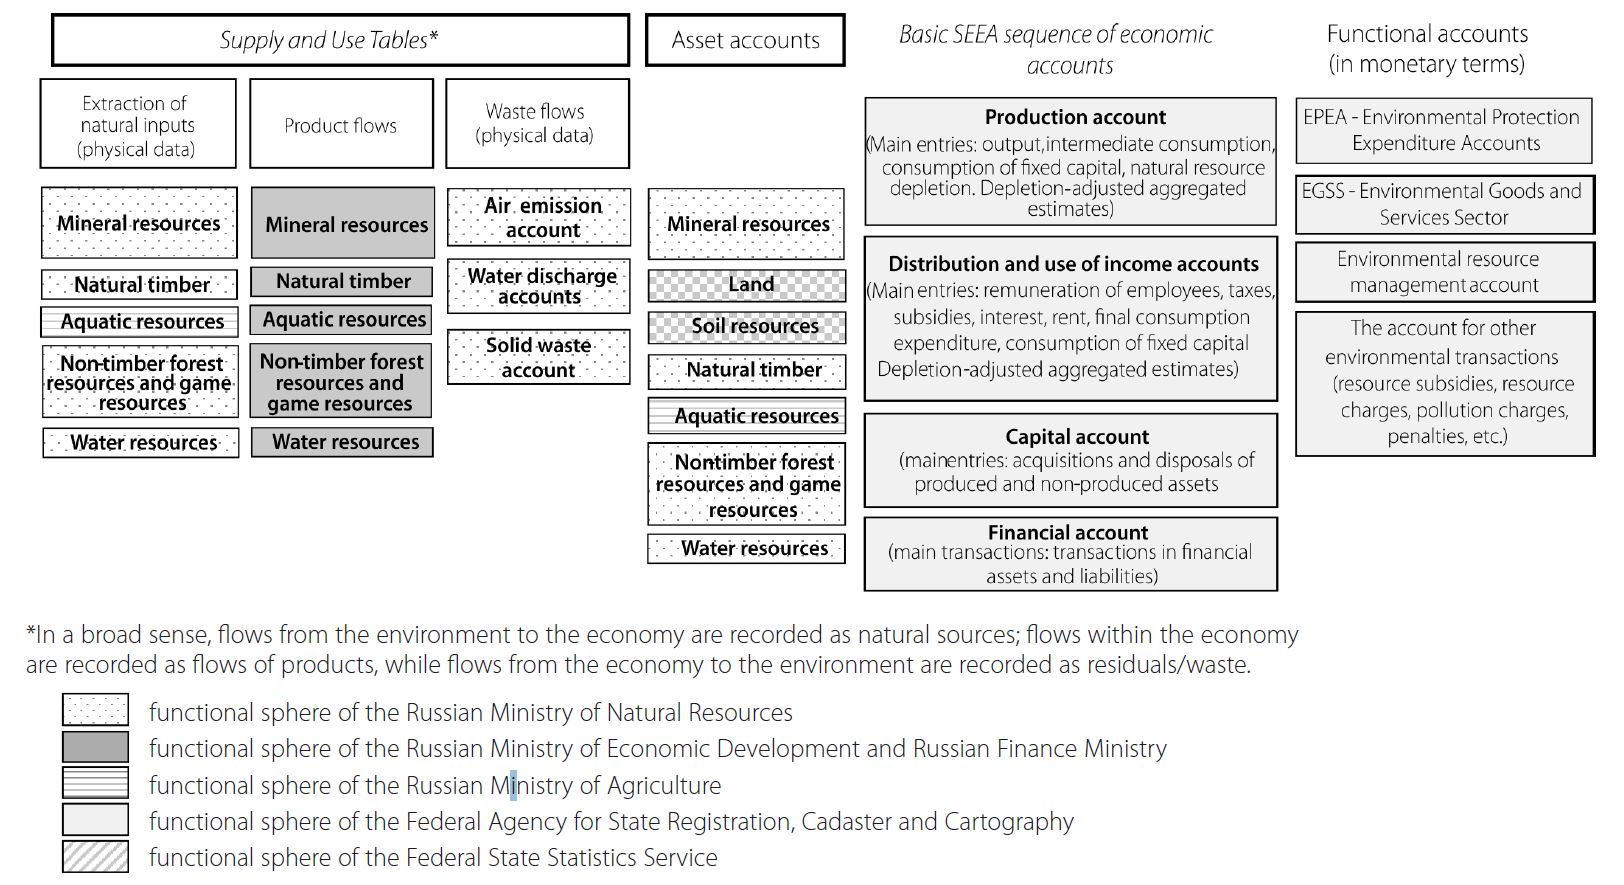
Fig. 2.1 Functional spheres of federal executive bodies in accumulating input information for environmental-economic accounting
To assess actual availability of inputs for SEEA estimates of the main types of environmental resources, it is worth considering the practical aggregation of primary statistical data and other existing information sources that can be used to derive the estimates included in:
- environmental asset accounts for water resources, mineral and energy resources and non-cultivated biological resources (timber and animals);
- physical flow accounts for air emissions, discharges to water bodies and solid waste disposal;
- the functional account for other transactions with environmental protection purposes.
In physical terms, each environmental asset has considerable volume measures (area, quantity, etc.), including all the resources of that asset which are capable of providing benefits for humanity. In monetary terms, however, the measured scope of the environmental asset is limited to elements, which have economic value, as established by the SEEA approach to monetary valuation.
So environmental asset accounts are designed to record the opening and closing stock of these assets, primarily in order to assess whether current patterns of economic activity are depleting and degrading the available environmental assets (thus providing information for efficient environmental management). The structure of an asset account starts with the opening stock of environmental assets and ends with the closing stock of environmental assets (Tables 2.8 and 2.9).
Table 2.8 Conceptual format of an environmental asset account in physical terms
|
Accounting unit |
Water resources |
Mineral and energy resources |
Non-cultivated biological resources |
||
|
Forest |
Animals |
||||
|
timber |
non-timber products |
||||
|
Opening stock of resources79 |
Yes |
Yes |
Yes |
Yes |
Yes |
|
Additions to the stock |
|||||
|
Growth in stock |
Precipitation Return flows |
N/A |
Natural growth |
Natural growth |
Natural growth |
|
Discoveries |
Yes* |
Yes |
N/A |
N/A |
Yes* |
|
Upward reappraisals |
Yes* |
Yes |
Yes* |
Yes* |
Yes |
|
Reclassification |
N/A |
Yes |
Yes |
Yes |
Yes |
|
Total additions to the stock |
|||||
|
Reductions in the stock |
|||||
|
Extraction |
Uptake of water |
Extraction |
Harvesting |
Harvesting |
Extraction |
|
Standard reductions of the stock |
Evaporation/ Evapotranspiration80 |
N/A |
Normal losses |
Normal losses |
Normal losses |
|
Catastrophic losses |
Yes* |
Yes* |
Yes |
Yes |
Yes |
|
Downward reappraisals |
Yes* |
Yes |
Yes* |
Yes* |
Yes |
|
Reclassifications |
N/A |
Yes |
Yes |
Yes |
Yes |
|
Total reductions in stock |
|||||
|
Closing stock of resources |
Yes |
Yes |
Yes |
Yes |
Yes |
Note: Yes – applicable, N/A – not applicable
*- the entry is not generally relevant for the resource or is not identified in input data In practice, not all the entries requiring completion need to be separately shown in published accounts for each type of resource
Source: UN, 2012a.
Table 2.9 Conceptual format of an environmental asset account in monetary terms (millions of rubles)
|
Opening stock of resources |
|
Additions to the stock |
|
Growth in stock |
|
Discoveries |
|
Upward reappraisals |
|
Reclassifications |
|
Total additions to stock |
|
Reductions in the stock |
|
Extraction |
|
Standard reduction in the stock |
|
Catastrophic losses |
|
Downward reappraisals |
|
Reclassifications |
|
Total reductions in stock |
|
Revaluation |
|
Closing stock of resources |
Source: UN, 2012a, p. 20.
Changes between opening stock and closing stock in physical terms are recorded as either additions to the stock or reductions of the stock; the character of such addition or reduction is indicated, if available. The same entries are included in monetary terms, with the addition of an entry to account for monetary revaluation of environmental assets. This entry shows changes in the value of assets over an accounting period, which are driven by movements of current prices for those assets.
We shall consider the specifics of compiling environmental asset accounts for water resources, mineral and energy resources, and non-cultivated biological resources (forest and animals), taking into account the availability of statistical, administrative and other primary information.
Water resources
Water resources include surface and ground water in water bodies, which are or can be used for drinking and household purposes, as well as for wastewater discharge, power generation, water and air transport, timber floating, etc. The multipurpose use of water suggests a multidimensional approach to water valuation in environmental-economical accounting.
Physical accounting
According to the System of Environmental-Economic Accounting (SEEA-W, 2012), the classification of water resources81 has the following categories:
EA.13: water resources (cubic meters)
EA.131: surface water
EA.1311: artificial reservoirs
A.1312: lakes
EA.1313: rivers and streams
EA.1314: glaciers, snow and ice
EA.132: groundwater
EA.133: soil water
Table 2.10 presents a sample asset account for water resources in physical terms. The columns show types of water resources in accordance with the asset classification, while the rows present details of the stocks and their changes caused by economic activities and natural processes.
Table 2.10 Sample standard water asset account in physical terms (millions of square meters)

null by definition.
Source: UN, 2012a, p. 204.
Stock of water
According to the SEEA 2012 (UN, 2012b), “The concept of a stock of water is related to the quantity of water in a reference territory measured at a specific point in time (usually the beginning or end of the accounting period).”
Surface water (ЕА.131)
In regard to artificial reservoirs (ЕА.1311), lakes (ЕА.1312), rivers and streams (ЕА.1313), this estimate reflects the volume of the reservoir (active channel of the river or stream) as determined by its area, profile and depth. Collection of the above data is not envisaged by the existing reporting forms of statistical monitoring and administrative reports. The existing practice of accounting only records the volume of surface river flows and water channels. Data on the stock of water in the biggest artificial reservoirs and lakes can be found in the materials of government departments and scientific research.
This testifies to the lack of comprehensive accounting and fragmentary character of the data, which are available for deriving estimates of the surface water stock. A system needs to be developed for recording the relevant primary data and/or for adjusting the existing statistical and administrative reporting forms.
With regard to glaciers, snow and ice (ЕА.1314), the relevant indicator is the volume of seasonal snow and ice layers and long-term accumulation of ice (glaciers) on the Earth’s surface, converted into water equivalent. The situation as to availability of primary data is similar to that for the above categories of water assets. Some scarce information on glaciers in the Russian Federation can be found in specialized research reports or publications. The question of how to formalize and use primary data on the volume of seasonal snow and ice layers and glaciers, obtained from existing monitoring services, in order to derive the relevant estimate is high on the agenda.
Groundwater (ЕА.132)
The indicator for this category of water resources is the volume of the stock available for use at a specific point in time.
The commonly accepted Russian classification of groundwater resources for accounting purposes is as follows: “Groundwater stocks are calculated based on the potential rated capacity of geologically and economically feasible water uptake facilities (projected or operating, including those subject to reconstruction) at predetermined operating modes and conditions, using a criterion of water quality that meets specifications for the relevant operating purpose over the rated service life of the water uptake facilities, taking account of environmental requirements and restrictions.” In calculating the water stock, the rated service life of a water uptake facility is normally taken to be up to 25 years.”82
In other words, the measure of the groundwater stock derived in the existing statistics reflects the technically and environmentally feasible uptake volume of a specific aquifer (deposit) rather than the capacity (resource amount) of the aquifer itself. Since the measure of potential volume of water uptake is determined taking account of all factors affecting stock increase and decrease, it may be taken to include the figures in “Additions to stock” and “Reductions in the stock” (Table 2.10). However, proper completion of column 5 of Table 2.10 will require formalization and separate numerical records of all relevant factors that are assessed in the determination of potential water uptake according to the Recommendations for classification of the stock and projected resources of drinking, service and mineral groundwater (with supplements, if necessary), including data on the reserves of the respective aquifer.
Soil water (ЕА.133)
Consistent with SEEA-W, 2012, (UN, 2012b, p. 200), soil water is defined as “water suspended in the uppermost belt of soil or the aeration zone near the ground surface, ... [which] can be discharged into the atmosphere by evapotranspiration.” The existing forms of statistical and administrative accounting do not record data on the supply and changes in soil water. Some expert information may be found in relevant research materials
Additions to stock
Water returns represent the volume of water that is returned to the environment by economic units during the accounting period (UN, 2012b, p. 200).
Surface water (ЕА.131)
For artificial reservoirs (ЕА.1311), lakes (ЕА.1312), rivers and streams (ЕА.1313), the estimate represents the volume of actually discharged wastewater of all kinds (treated, untreated, etc.) The indicator can be derived by using the data of the statistical monitoring reporting form, “Information on the use of water,” section 2. Wastewater removal In compliance with the water resource categories under consideration, the data on sewerage facilities under code numbers 20, 21, 30, 31, 40, recorded in column 4 of section 2, are used. The data in column 11 is used to derive the indicator for water returns for these types of sewerage facilities.
The indicator is not derived for glaciers, snow and ice (ЕА.1314).
Groundwater (ЕА.132)
The indicator can be derived by using the data of the statistical monitoring reporting form, “Information on the use of water,” section 2. Wastewater removal In compliance with the water resource categories under consideration, the data on sewerage facilities under code numbers 60, 61, 81, 82, 83, recorded in column 4 of section 2, are used. In respect to these types of sewerage facilities, the total estimate of water returns is derived from the data of column 11, section 2.
Soil water (ЕА.133)
The indicator can be derived by using the data of the statistical monitoring reporting form, “Information on the use of water,” section 2 Wastewater. In compliance with the water resource category under consideration, the data on sewerage facilities under code number 80, as recorded in column 4 of section 2, are used. The estimate of water returns for these types of sewerage facilities is derived from the data of column 11.
Precipitation consists of the volume of atmospheric precipitation (rain, snow, hail, etc.) on the reference territory during the accounting period before evapotranspiration takes place. The greater part of precipitation falls on soil and should be recorded as “soil water” in asset accounts. Some precipitation may also fall into other water resources, e.g., surface water bodies. It is assumed that water would reach aquifers after having passed through the soil or surface water (rivers and lakes); so no precipitation is shown in the asset accounts for groundwater. The infiltration of precipitation to groundwater is recorded in the accounts as an inflow from other water resources into groundwater.
The existing forms of statistical and administrative accounting do not record data on precipitation. The materials provided by the Russian meteorological service (Roshydromet) on the environmental situation and/or pollution in the Russian Federation contain information on precipitation in relative measures (mm/month and % of normal precipitation).83 Converting these data into absolute volumes of water and allocating them among specific categories of water resources will require special research efforts.
Inflows represent the amount of water that flows into water resources during an accounting period. The inflows are disaggregated according to their origin:
- inflows from other upstream territories;
- inflows from other water resources in the territory.
Inflows from other territories occur when water resources are shared. For example, in the case of a river that enters the reference territory, the inflow is the total volume of water that flows into the territory at its entry point during the accounting period If a river runs along the border of two countries without entering either of them, each country could claim a percentage of the flow to be attributed to its territory. If no formal convention exists, a practical solution is to attribute 50 percent to each country. Inflows from other resources include transfers, both natural and man-made, between the resources within the territory. They include, e.g., flows due to water infiltration and seepage and flows in artificial distribution channels (UN, 2012b, p. 100-101).
Surface water (ЕА.131)
Estimates for artificial reservoirs (ЕА.1311) and lakes (ЕА.1312), can be made using the data of form 1.13-gvr “Water bodies. Main hydrological characteristics of rivers. Average and specific discharge,” regarding mean annual flows of rivers and streams of other territories flowing into water bodies on the reference territory at the point where they cross the border between these territories (countries, etc.)84 .
For rivers and streams (ЕА.1313), the indicator can be derived from the data of form 1.13-gvr on mean annual flows of the respective water body at the point where it crosses the border between the reference territory and other territories (countries, regions, etc.)
No data are available for this kind of estimate with respect to glaciers, snow and ice (ЕА.1314) and groundwater (ЕА.132).
Inflow from other water resources within the territory can occur from surface water bodies (including inflows through underground aquifers) and from glaciers, snow and ice.
Surface water (ЕА.131)
For artificial reservoirs (ЕА.1311) and lakes (ЕА.1312), the indicator can be obtained using data in the State Water Register, form 1.13-gvr “Water bodies.” Main hydrological features of rivers. Average and specific discharge,” regarding mean annual flows of rivers and streams of the reference territory, which flow into water bodies of the relevant categories.
The indicator for rivers and streams (ЕА.1313) can be derived from the data of form 1.13-gvr on mean annual flows of rivers and streams in the reference territory flowing into the water body of the relevant category. The indicator can also be derived from data on additions to surface water (ЕА.131) due to underground aquifers. Currently, this kind of data can be found in specialized research materials and the results of monitoring.
No data are available for this kind of estimate with respect to glaciers, snow and ice (ЕА.1314), groundwater (ЕА.132) and soil water (EA.133).
Reductions in the stock
Uptake of water is the amount of water removed from any source, either permanently or temporarily, in a given period for consumption or production (UN, 2012b, p. 101).
Surface water (ЕА.131)
For artificial reservoirs (ЕА.1311), lakes (ЕА.1312), rivers and streams (ЕА.1313), the indicator shows the volume of water factually taken from natural water sources. The indicator can be derived by using the data in statistical monitoring reporting form 2-tp (water management), “Information on the use of water,” section 1 (water taken from natural sources, received from suppliers, used, transferred and lost). Only data showing the volume of water uptake directly from water supply sources are used. The volume of water received from suppliers is not taken into account In compliance with the water resource categories under consideration, data on water supply sources under code numbers 20, 21, 30, 40, recorded in column 4 of section 1, are used. The total estimate of water uptake from these types of water sources is derived from the data of column 12, section 1.
The indicator is not derived for glaciers, snow and ice (ЕА.1314) due to the lack of data.
Groundwater (ЕА.132)
The indicator can be derived using the data in statistical monitoring reporting form 2-tp (water management), “Information on the use of water,” section 1 (water taken from natural sources, received from suppliers, used, transferred and lost). Only data showing the volume of water uptake directly from underground aquifers are used. The volume of water received from suppliers is not taken into account In compliance with the water resource categories under consideration, data on water sources under code numbers 60, 61, 62, recorded in column 4 of section 1, are used The total estimate of water uptake from these types of water sources is derived from the data of column 12, section 1.
Soil water (ЕА.133)
No indicator is prepared, due to the lack of data.
Evaporation / actual evapotranspiration is the amount of evaporation and evapotranspiration occurring on the reference territory during an accounting period. Evaporation means the amount of water that evaporates from water bodies, such as rivers, lakes and artificial reservoirs. Evapotranspiration means the amount of water transferred from the soil to the atmosphere as a result of evaporation and plant transpiration. Evapotranspiration may be potential or actual depending on the soil and vegetation conditions. Potential evapotranspiration is the maximum quantity of water capable of being evaporated in a given climate from a continuous stretch of vegetation that covers the whole ground and is well supplied with water.
Actual evapotranspiration refers to the amount of water that evaporates from the land surface and is transpired by the existing vegetation/plants when the ground is at its natural moisture content as determined by precipitation. It should be noted that actual evapotranspiration can only be estimated using models and will be an approximate amount.
At present, the input data necessary for deriving the indicator under consideration are not recorded in statistical monitoring reporting forms and administrative accounting. Some data can be found in specialized research materials and monitoring results.
Outflows represent the amount of water that flows out of water resources during an accounting period. Outflows are accounted depending on the destination of the flow, namely:
1. outflows to other territories/countries, being the total amount of water that flows out of the reference territory during an accounting period. Shared rivers are typical examples of water flowing out of the upstream country to the downstream country;
2. outflows to the sea/ocean, constituting the amount of water flowing into these water bodies;
3. outflows to other water resources within the territory, representing the exchange of water resources within the territory. These include in particular water flowing out of a water body and reaching other water bodies within the given territory (UN, 2012b, p. 101).
Outflows to downstream territories
Surface water (ЕА.131)
The indicator for rivers and streams (ЕА.1313) can be derived from the data of form 1.13-gvr on mean annual flows of the respective water body at the point where it crosses the border between the reference territory and other territories (countries, etc.).
Outflows to the sea/ocean
Surface water (ЕА.131)
The indicator for rivers and streams (ЕА.1313) can be derived from the data of form 1.13-gvr on mean annual flows of the respective water body at the point where it flows into the sea in the reference territory.
Outflows to other water resources within the territory
Surface water (ЕА.131)
The indicator for artificial reservoirs (ЕА.1311) and lakes (ЕА.1312) can be calculated using the data of form 1.13-gvr on mean annual flows of artificial water courses of rivers and streams (ЕА.1313) at the point of their outflow from water bodies in the reference territory ЕА.1311 and ЕА.1312.
The indicator for rivers and streams (ЕА.1313) can be derived from the data of form 1.13-gvr on mean annual flows of the respective water body at the point where it flows into other water bodies of the reference territory (river, lake, artificial reservoir, etc., excluding the sea).
The indicator is not derived for glaciers, snow and ice (ЕА.1314).
Groundwater (ЕА.132)
The indicator can be derived from data on additions to surface water (ЕА.131) due to underground aquifers. Currently, this kind of data can be found in specialized research materials and the results of monitoring.
Soil water (ЕА.133)
No indicator is prepared, due to the lack of data.
Other changes in the volume include all changes in the stock of water that are not classified by other positions in the table. This entry may include, e.g., the amount of water in aquifers discovered during the accounting period and disappearance or appearance of water due to natural disasters, etc. Other changes in the volume can be calculated directly or residually.
Thus, despite a considerable amount of statistics and administrative accounting forms, the data required for deriving SEEA estimates for water resources are not recorded specifically, but are included in more general estimates (e.g., evaporation volume is included in recording of water levels in water bodies).
The Inflow and Outflow indicators are only supported by statistical and administrative information with respect to surface water flows. The respective statistical data on standing water bodies is incomplete, and there is no information at all on groundwater and soil water (Table 2.11).
Table 2.11 Aggregating primary data to establish a standard form of physical asset accounting for water resources, millions of rubles
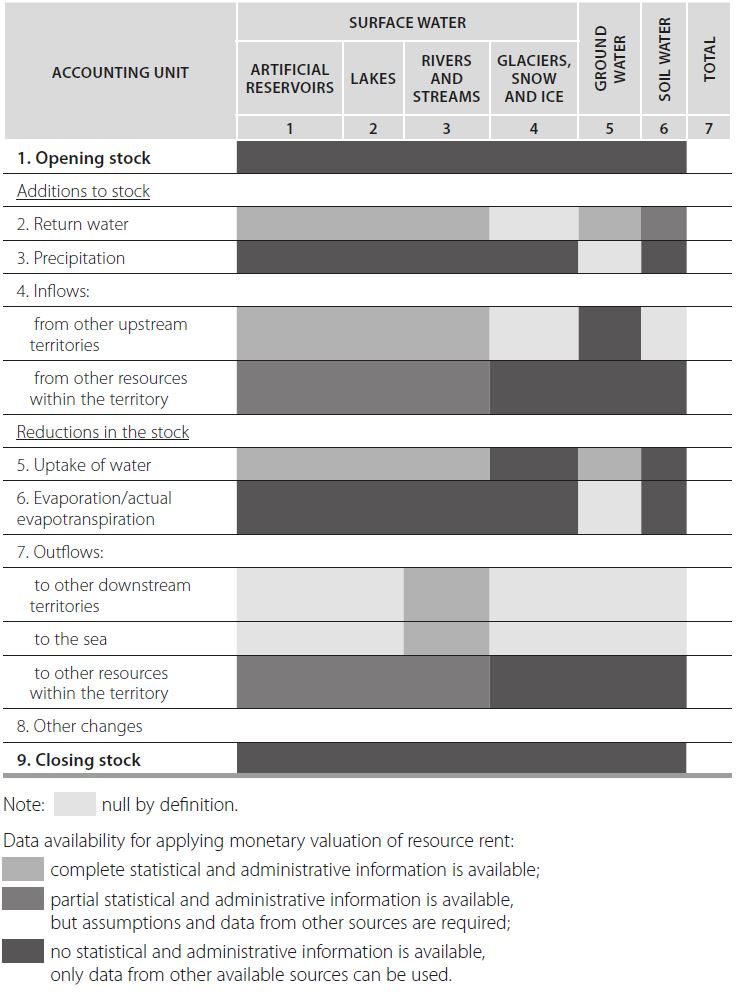
The existing accounting and reporting forms do not contain physical measures of simultaneously observed surface and ground water stocks, absolute volume of precipitation and evaporation/evapotranspiration. Some information can be obtained from research materials or from publications and specialized sources, though it is quite fragmentary. For these reasons, in Russia, a territory’s water balance sheet to SEEA standards is inevitably incomplete, and is only based on the principal water use indicators.
Monetary accounting
The main problem is that, historically, water has often been made available free of charge as a public good and supplied cheaper than the cost of production, in order to support agricultural production, or at a flat charge. The price of water has therefore tended to be associated with the fixed infrastructure costs of collecting and transporting it to where it is needed rather than with actual volume of water used, which may vary significantly depending on territory-specific conditions.
In this context, standard approaches to the valuation of water assets and, in particular, the net present value approach, cannot be applied because the resource rent that is derived by following the standard definitions is negative. Estimates of negative resource rent arise when the income earned from the sale of water uptake does not cover the costs of maintaining the produced assets required to operate pipe networks and facilities. Consequently, the value of the water resources themselves is considered being zero.
The existing international regulations on environmental-economic accounting of water resources do not provide any methodology for breaking this impasse, since they are focused mostly on methods of water valuation and their alignment with the valuation approaches used in the SEEA-2008, and only provide reviews of existing practices for the monetary valuation of water. The SEEA-W also fails to give any specific recommendations on the choice of valuation methods, since it lacks a unified approach to valuation methods and their inclusion in the environmental-economic accounting toolbox. These questions can and must be solved on a case-by-case basis depending on the particular context of water resource use in a country.
Stock of water
With respect to water resource stock, economic benefits are accounted in the form of:
- operating surplus (for the user) from the uptake and sale of water;
- water rent received (by government) for issuing permits to use or take water.
The service life of the stock and the period of resource rent are not limited.
Surface water (ЕА.131)
For artificial reservoirs (ЕА.1311), lakes (ЕА.1312), rivers and streams (ЕА.1313), the indicator (unlike an analogous indicator in physical terms) is the sum total of future (usually annual) discounted receipt of water rent. Calculation of resource rent (by the residual value method) is based on data from the following reporting forms: OKVED-41.0 (Russian Classification of Economic Activities) on collection, treatment and distribution of water from forms No.P-1, “Information on production and shipping of goods and services,” section 2, No.5-3, “Information on cost of production and sale of products (goods, work, services)” and No.P-3 “Information on financial standing of the company.” The resulting water rent often has negative value (except for hydropower generation, agricultural irrigation, bottled water production, etc.)
The use of an appropriation method provides a minimum value of the stock’s monetary estimate. The existing tariffs for water uptake from surface sources are, in general, socially motivated. Data from the Federal Tax Service form No.5-VN, “Report on the tax base and assessment structure for water tax,” can be used as an input source for applying the appropriation method (the amount obtained in point 2 as the difference between lines 210 and 222 minus point 3: difference between lines 410 and 422). The value obtained is the annual amount of the part of water rent received by the government for granting the right to use water bodies, taking account of hidden subsidies for public water supply.
The indicator is not derived for glaciers, snow and ice (ЕА.1314).
Groundwater (ЕА.132)
The estimate for groundwater assets is derived in largely the same way as the estimate for surface water (ЕА.131). Data from the Federal Tax Service form No.5-VN, “Report on the tax base and assessment structure for water tax,” can be used as an input source for applying the appropriation method (the amount obtained in point 2 as the difference between line 222 and the amount from point 3: line 422). The value derived is the annual amount of the part of the water rent received by the government for granting the right to use groundwater, taking account of hidden subsidies for public water supply.
No indicator is derived for soil water (EA.133), due to the absence of input data.
Changes in the stock
The figure for changes in the value of the stock of all water resources considered during an accounting period (except for revaluations) is calculated as the product of the specific water rent and the change in physical terms, with the appropriate sign, “+” or “-”.
Taking the above points into account, Table 2.12 presents different options for evaluating water rent and aggregating primary statistical and administrative data in order to derive indicators for monetary accounting of water resources in Russia today. As seen from Table 2.12, the best approach to water resource valuation in the current economic situation is the appropriation method. The methods of residual value and access price, which could potentially be used with the same scope, would require greater financial and labor costs.
Table 2.12 Aggregating primary data to establish a standard form of monetary asset account for water resources, millions of rubles
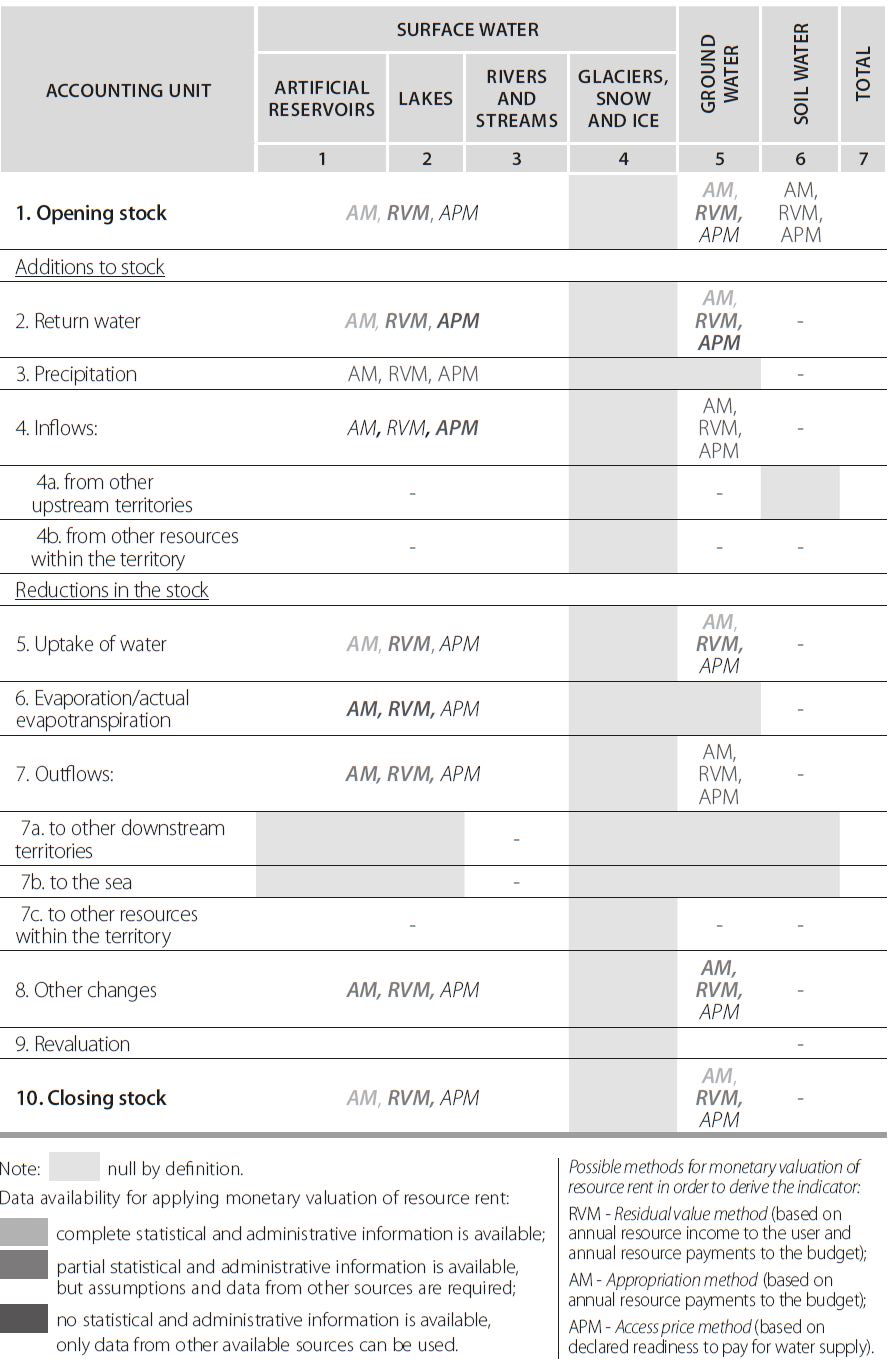
Mineral and energy resources
There are a number of different types of mineral and energy resources, such as crude oil, natural gas, coal and peat, non-metallic and metallic minerals. However, no internationally agreed classification for fossil energy and mineral resources has been proposed that would be suitable for statistical purposes (UN, 2012a, p. 178). For convenience, the following classification of fossil energy and mineral resources is customary (based on the framework of the SEEA 2012)
- crude oil resources
- natural gas resources
- coal and peat resources
- non-metallic mineral resources
- metallic mineral resources
Physical accounting
Since mineral and energy resources are non-renewable natural resources, it is important that any extraction volume be recorded as physical depletion of the stock. With respect to mineral resources, the sample asset account in physical terms will have the following form (Table 2.13).
Table 2.13 Sample physical asset account for mineral and energy resources
|
Accounting unit |
Type of mineral and energy resource (A, B and C1) resource categories |
||||
|
Crude oil resources (thousands of barrels) |
Natural gas resources (cubic meters) |
Coal and peat resources (thousands of tons) |
Non-metallic mineral resources (tons) |
Metallic minerals (thousands of tons) |
|
|
Opening stock of mineral and energy resources |
800 |
1,200 |
600 |
150 |
60 |
|
Additions to stock |
|||||
|
Discoveries |
20 |
||||
|
Upward reappraisals |
200 |
40 |
|||
|
Reclassifications |
|||||
|
Total additions to the stock |
200 |
40 |
20 |
||
|
Reductions in stock |
|||||
|
Extraction |
40 |
50 |
60 |
10 |
4 |
|
Catastrophic losses |
|||||
|
Downward reappraisals |
60 |
||||
|
Reclassifications |
|||||
|
Total reductions in stock |
40 |
50 |
120 |
10 |
4 |
|
Closing stock of mineral and energy resources |
760 |
1,350 |
480 |
180 |
76 |
Source: UN, 2012a.
It is noted that, following the UN Classification of Fossil Energy and Mineral Reserves and Resources (UNFC-2009) (UN, 2012a, table 5.6), the SEEA categorizes known deposits into three classes: Class A includes commercially recoverable resources, Class B includes potentially commercially recoverable resources, and Class C includes non-commercial and other known deposits. According to the classification used in Russia, Class A includes resources falling under categories A, B and C1, Class B corresponds to category C2, while Class C includes forecast resources. Only in-place reserves are taken into account. Accounting of the mineral resource stock and its dynamics is based on classes of resource (UN, 2012a, p. 179, par. 5.5.3). We will look more closely at the structure and content of the indicators used in physical asset accounts within the SEEA.
Reserves
Reserves are the quantity of mineral and energy resources of a certain type and class within the boundaries of the reference territory at a definite point of time (beginning and end of an accounting period). The indicator can be derived using data in federal statistical monitoring reporting forms:
- 5-gr “Information on the state and changes in reserves of solid mineral deposits,” values in columns 6 and 14;
- 6-gr “Information on the state and changes in reserves of oil, gas, condensate, ethane, propane, butane, sulfur, helium, nitrogen, carbon dioxide, vanadium and nickel admixtures in oil,” values in columns 7, 12 and 13.
Additions to reserves
Discoveries, i.e., the quantity of mineral and energy resources discovered during the accounting period (UN, 2012a, p. 180). The indicator can be derived using data in federal statistical monitoring reporting forms:
- 5-gr “Information on the status and changes in reserves of solid mineral deposits,” values in column 10 with a “+” sign;
- 6-gr “Information on the status and changes in reserves of oil, gas, condensate, ethane, propane, butane, sulfur, helium, nitrogen, carbon dioxide, vanadium and nickel admixtures in oil,” values in column 9 with a “+” sign.
Upward reappraisals are additions to the available reserves of mineral and energy resources of specific deposits or changes to categorization of specific deposits between classes A, B or C based on changes in geological information, technology, resource price or a combination of these factors during an accounting period (UN, 2012a, p. 180). The indicator can be derived using data in federal statistical monitoring reporting forms:
- 5-gr “Information on the status and changes in reserves of solid mineral deposits,” values in column 11 with “+” sign;
- 6-gr “Information on the status and changes in the reserves of oil, gas, condensate, ethane, propane, butane, sulfur, helium, nitrogen, carbon dioxide, vanadium and nickel admixtures in oil,” values in column 10 with “+” sign.
Reclassifications may occur if certain deposits are opened to mining operations owing to government decisions concerning access rights to a deposit during an accounting period (UN, 2012a, p. 181). The indicator can be derived using data in federal statistical monitoring reporting forms:
- 5-gr “Information on the status and changes in reserves of solid mineral deposits,” values in column 13 with “+” sign;
- 6-gr “Information on the status and changes in reserves of oil, gas, condensate, ethane, propane, butane, sulfur, helium, nitrogen, carbon dioxide, vanadium and nickel admixtures in oil,” values in columns 14 and 15 with “+” sign.
Reductions in reserves
Extraction is the quantity of the resources physically removed from the deposit during an accounting period. It should exclude mining overburden, i.e., the quantity of soil and other material moved in order to extract the resource. Further, the quantity of extraction should be estimated before any refinement or processing of the resource is undertaken. Estimates of extraction should include estimates of illegal extraction, either by residents or non-residents, as these amounts reduce the availability of the resource (UN, 2012a, p.180). The indicator can be derived using data in federal statistical monitoring reporting forms:
- 5-gr “Information on the status and changes in reserves of solid mineral deposits,” values in columns 8 and 9;
- 6-gr “Information on the status and changes in reserves of oil, gas, condensate, ethane, propane, butane, sulfur, helium, nitrogen, carbon dioxide, vanadium and nickel admixtures in oil,” values in column 8.
Catastrophic losses are rare in relation to most mineral and energy resources. Flooding and collapsing of mines do occur but the deposits continue to exist and can be recovered; the issue is one of economic viability of extraction rather than actual loss of the resource itself. An exception to this general principle concerns oil wells that can be destroyed by fire or become unstable for other reasons, leading to significant losses of oil resources. Losses of oil and related resources in this situation should be considered catastrophic losses (UN, 2012a, p. 181). The estimate can be derived by using data in the reporting form of federal statistical monitoring 5-gr “Information on the status and changes in reserves of solid mineral deposits,” values in column 13 with “-” sign.
Downward reappraisals are withdrawals from the available stock of mineral and energy resources of specific deposits or changes to categorization of specific deposits between class A, B or C based on changes in geological information, technology, resource price or a combination of these factors during an accounting period (UN, 2012a, p. 180). The indicator can be derived using data in federal statistical monitoring reporting forms:
- 5-gr “Information on the status and changes in reserves of solid mineral deposits,” values in column 11 with “-” sign;
- 6-gr “Information on the status and changes in reserves of oil, gas, condensate, ethane, propane, butane, sulfur, helium, nitrogen, carbon dioxide, vanadium and nickel admixtures in oil,” values in column 10 with “-” sign.
Reclassifications may occur if certain deposits are closed to mining operations owing to government decisions concerning the access rights to a deposit during an accounting period (UN, 2012a, p. 181). The indicator can be derived using data in federal statistical monitoring reporting forms:
- 5-gr “Information on the status and changes in reserves of solid mineral deposits,” values in column 13 with “-” sign;
- 6-gr “Information on the status and changes in reserves of oil, gas, condensate, ethane, propane, butane, sulfur, helium, nitrogen, carbon dioxide, vanadium and nickel admixtures in oil,” values in columns 14 and 15 with “-” sign.
Having analyzed the available information, we assessed the possibility of accounting of mineral and energy resources in physical terms within the SEEA framework (Table 2.14). As shown in the table, the available information on mineral and energy resources is sufficient for compiling the respective physical asset accounts; the information is contained in the statistical reports drawn up within the framework of the Federal Agency for Subsoil Use.
Table 2.14 Aggregating primary data for compiling physical asset accounts for mineral and energy resources
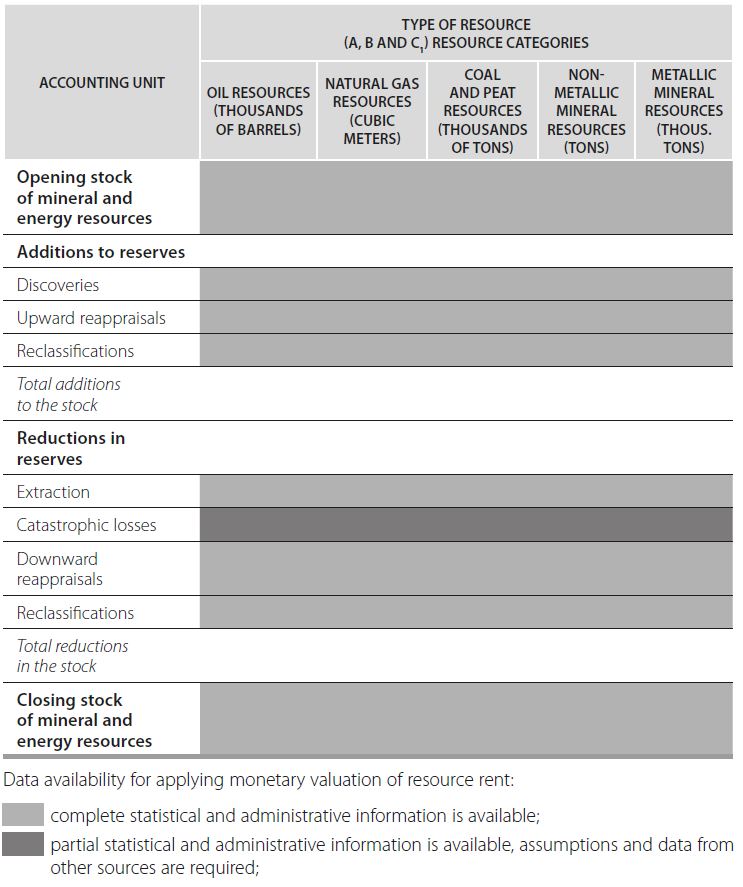
Monetary accounting
The monetary evaluation of mineral and energy resources should take account of a number of specific factors that refer mostly to the calculation of resource rent and forecasting the quantity of extraction and productive life of deposits.
To estimate the mineral resource rent by the appropriation method, input data can be obtained from the Federal Tax Service reporting form 1-NM “Report on assessment and receipt of taxes, duties and other statutory charges to the Russian budget,” lines 1745, 1750, 1755, 1760, 1770, 1785 and 1788, depending on the type of the deposit being evaluated. The values obtained are the annual amounts of the part of the mineral resource rent accruing to the government as compensation for granting rights to mineral and energy resources.
Calculation of resource rent by the residual value method uses data from the following reporting forms: OKVED (Russian Classification of Economic Activities) – Section C Mineral resource extraction (only the items referring to extraction) from forms No.P-1 “Information on production and shipping of goods and services” (section 2), No.5-3 “Information on cost of production and sale of products (goods, work, services)” and No.P-3 “Information on financial standing of the company.” Estimation of mineral and energy resources by the access price method uses information on the price of exploration and production licenses, and the dates and quantity of relevant transactions as reported by the newsletter, Nedropolzovanie v Rossii /Use of Subsoil Resources in Russia/. Aggregated primary data for compiling monetary asset accounts for mineral and energy resources are shown in Table 2.15.
Table 2.15 Aggregating primary data for compiling monetary asset accounts for mineral and energy resources
Since the quantity of extraction of mineral and energy resources is estimated in the SEEA as resource depletion (in contrast to “Other asset changes” within the SNA), this value is important for calculating depletion-adjusted macroeconomic estimates in the production accounts and appropriation accounts.
Non-cultivated biological resources (forests and animals)
Aggregation of primary data for compiling estimates of physical and monetary accounting in the asset accounts for non-cultivated biological resources is considered with regard to timber, non-timber forest products and animals.
Timber
Timber resources are found in a wide variety of territories. They may exist in the form of felled or unfelled forest, and may or may not be available to be felled and used as wood supply, i.e., to produce timber products or as fuel wood. Timber resources may be unavailable for timber supply because the trees:
1) are in areas where forest harvesting operations are restricted or prohibited;
2) are in remote or inaccessible areas, i.e., where harvesting is not profitable;
3) are not included in the scope of commercially harvested wood species for biological reasons (UN, 2012a, p. 215).
Based on these considerations, we will examine the task of compiling timber resource asset accounts in physical and monetary terms.
Physical accounting
Only natural timber resources are accounted for in the framework of the SEEA (Table 2.16).
Table 2.16 Sample physical asset account for timber resources, thousands of cubic meters
|
Accounting unit |
Timber resource type |
|
|
Natural timber resources |
||
|
Available for wood supply |
Not available for wood supply |
|
|
Opening stock of timber resources |
8,000 |
1,600 |
|
Additions to stock |
||
|
Natural growth |
1,100 |
20 |
|
Reclassifications |
150 |
|
|
Total additions to stock |
1,250 |
20 |
|
Reductions in the stock |
||
|
Removals |
1,000 |
|
|
Felling residues |
120 |
|
|
Natural losses |
30 |
20 |
|
Catastrophic losses |
||
|
Reclassifications |
150 |
|
|
Total reductions in stock |
1,150 |
170 |
|
Closing stock of timber resources |
8,100 |
1,450 |
|
Supplementary information |
||
|
Felling |
1,050 |
|
Source: UN, 2012a.
While timber resources that are not available for wood supply do not possess an economic value, these timber resources remain in the scope of timber resources in the SEEA in physical terms, as they meet the definition of environmental assets and may provide benefits. However, since these resources do not have an economic value, they are not recorded in the asset accounts in monetary terms. Consequently, the volume of these timber resources in physical terms should be clearly identified so that appropriate alignment can occur between asset accounts in physical terms and monetary terms.
The volume of unavailable timber resources recorded in statistical sources in Russia can be identified with respect to the causes of their unavailability as follows:
1) timber in areas where forest harvesting operations are restricted or prohibited consists of timber resources in protective forests and special protective forests, forests in protected natural areas, forest preserves, protected shoreline belts, etc. (Russian Forest Code, pp. 102-107);
2) timber in remote or inaccessible areas where harvesting is not profitable consists of the difference between the total timber stock in the reference territory and the exploitable volume85;
3) timber that is not included in the scope of commercially harvested wood species for biological reasons86.
Stock of resources
The stock of timber available and unavailable for supply is defined as the volume of timber within the boundaries of the reference territory at a given point in time (beginning or end of an accounting period).
a) Timber resources available for supply. The estimate can be derived by using data in reporting forms of the State Forest Register:
- Form 1.8 State Forest Register “Allocation of forest areas and timber resources by prevailing species and age group,” column 10, line “Total main forest forming species”;
- Form 1.8 State Forest Register “Allocation of forest areas and timber resources by prevailing species and age group,” column 10, each line of section “1. Main forest forming species”;
a) Timber resources unavailable for supply. The estimate can be derived by using data in reporting forms of the State Forest Register:
- Form 1.8 State Forest Register “Allocation of forest areas and timber resources by prevailing species and age group,” column 10, lines “Total of other forest forming species” and “Total brushwood”;
- Form 1.8 State Forest Register “Allocation of forest areas and timber resources by prevailing species and age group,” column 10, for each line of section “2. Other tree species” and “3. Brushwood.”
Additions to stock
Natural growth is measured in terms of gross annual increment, i.e., the volume of increment of all trees over the reference period. The estimate of natural growth should be based on the timber resources available at the beginning of the accounting period. Increases in the area of forest land, other wooded land and other land areas that lead to increases in the volume of available timber resources should not be considered as natural growth but should, instead, be recorded as “Reclassifications” (UN, 2012a, p. 217).
a) Timber available for supply. The estimate can be derived by using data in reporting forms of the State Forest Register:
- Form 1.8 State Forest Register “Allocation of forest areas and timber resources by prevailing species and age groups,” column 17, line “Total of main forest forming species”;
- Form 1.8 State Forest Register “Allocation of forest areas and timber resources by prevailing species and age groups,” column 17, each line of section “1. Main forest forming species.”
b) Timber resources unavailable for supply. The estimate can be derived by using data in reporting forms of the State Forest Register:
- Form 1.8 State Forest Register “Allocation of forest areas and timber resources by prevailing species and age groups,” column 17, lines “Total other forest forming species” and “Total brushwood”;
- Form 1.8 State Forest Register “Allocation of forest areas and timber resources by prevailing species and age groups,” column 17, each line of section “2. Other tree species” and “3. Brushwood.”
Reclassification consists of increase in the volume of timber resources over the accounting period due to:
- increase in the area of forest land and other wooded land;
- changes in management practice that shift timber resources from cultivated to natural and vice versa.
This estimate is not registered as a separate value in the reporting forms of statistical and administrative accounting.
Reductions in the stock
Removals are estimated as the volume of timber resources removed from forest and other wooded land during the accounting period. They include removals of trees felled in earlier periods and removal of trees killed or damaged by natural causes. Removals can be recorded by type of product (e.g., industrial round wood or fuel wood) or by species of tree (e.g., coniferous or broad-leaved). Since the reporting forms of statistical monitoring and administrative accounting do not register data on timber removals according to the above-mentioned SEEA categories, we have used the volume of harvesting (felling), which duplicates the “Timber harvesting” indicator below, to obtain an estimate for this parameter.
The figure is only derived for natural resources available for supply. The estimate can be derived by using data in reporting forms of the State Forest Register:
- 2.3 State Forest Register “Use of forest by individuals and legal entities,” columns 12, 13, 14 and 15, lines “Total for forest district (forest park),” “including leaseholders”;
- 2.4 State Forest Register “Timber harvesting under forest sale and purchase agreements and contracts concluded for forest protection, conservation and regeneration services,” columns 11, 12, 16 and 17, final line.
Felling residues must be deducted in order to fully account for the change in the volume of timber resources over an accounting period. These residues arise because, at the time of felling, a certain volume of timber resources is rotten, damaged or excessive. Felling residues exclude small branches and other parts of the tree, which are excluded from the scope of timber resources. Estimates of felling residues may provide important information on the nature of forestry practice (UN, 2012a, p. 218). Currently, data on the volume of felling residues are not registered in reporting forms of statistical and administrative accounting as a separate item.
Natural losses are losses of growing stock (i.e., living, standing trees) during an accounting period due to mortality from causes other than felling. Examples include losses due to natural mortality, insect attack, fire, wind throw and other physical damage. Natural losses include only those losses that can be reasonably expected when considering timber resources as a whole. These losses should only be recorded if there is no possibility that the timber resources can be removed. All timber removed should be recorded in removals.
Catastrophic losses should be recorded when there are exceptional and significant losses of timber resources due to natural causes and when there is no possibility that the timber resources can be removed
Since the current reporting forms of statistical and administrative accounting do not divide information on timber losses into natural and catastrophic losses, it appears expedient to record them as a consolidated estimate in the accounts. The estimate can be derived by using data in the following reporting forms:
- 3.1 State Forest Register “Information on forest fires,” column 23, line “Total for forest district (forest park)”;
- form 9-OIP “Forest losses due to forest fires,” column 1, line 31 “Forest products burned and damaged (value reduction), of which: timber harvested.”
Reclassification is reduction in the volume of timber resources over the accounting period due to:
- decrease in the area of forest land and other wooded land
- changes in management practice that shift a specific volume of timber resources from cultivated to natural and vice versa.
This estimate is not registered as a separate value in the reporting forms of statistical and administrative accounting.
Felling refers to the volume of timber resources that is felled during an accounting period (as distinct from the volume of timber removed). Annual felling is equal to the volume of timber resources felled during an accounting period. Felling includes silvicultural and pre-commercial thinning and cleaning. The figure is only derived for natural resources available for supply. The estimate can be derived by using data in reporting forms of the State Forest Register:
- 2.3 State Forest Register “Use of forest by individuals and legal entities,” columns 12, 13, 14 and 15, lines “Total for forest district (forest park),” “including leaseholders”;
- 2.4 State Forest Register “Timber harvesting under forest sale and purchase agreements and contracts concluded for forest protection, conservation and regeneration services,” columns 11, 12, 16 and 17, final line.
Availability of information support for physical timber accounts in the SEEA framework is given in Table 2.17.
Table 2.17 Aggregates of primary data for compiling physical asset accounts for timber resources, thousands of cubic meters
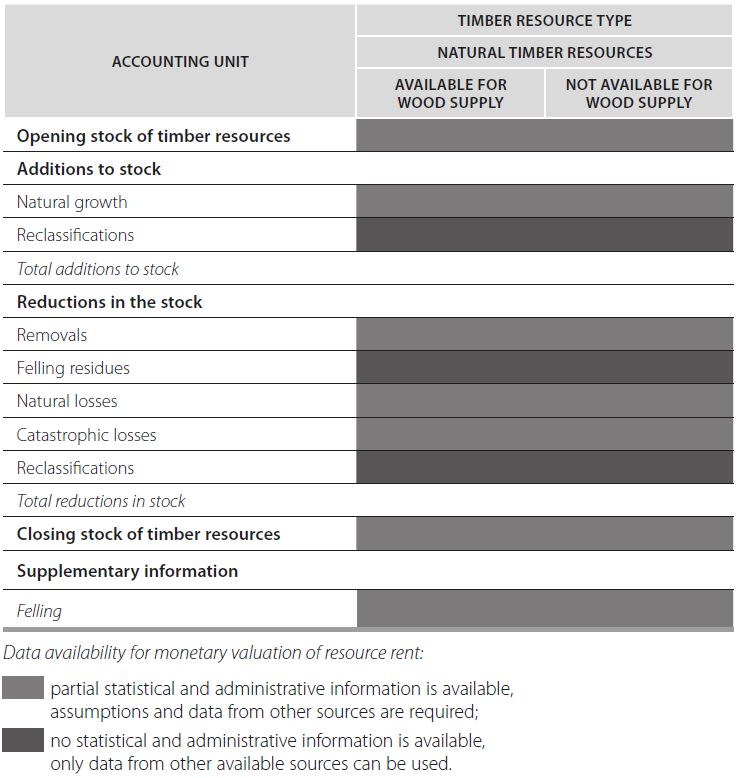
Overall, we would stress the following main points:
1. The existing systems of statistical monitoring and administrative accounting of timber resources do not distinguish between resources available for supply and those unavailable for supply.
2. The existing forms do not account for “Reclassifications,” so the value of Natural Growth cannot be unambiguously attributed to growth due only to natural causes.
3. The existing systems of statistical monitoring and administrative accounting of timber resources do not envisage differentiation of harvesting into felling and removals.
4. Existing reporting forms need to be supplemented by separate accounting to distinguish between natural and catastrophic losses.
Monetary accounting
Resource rent from timber resources can be calculated by the residual value method as the gross operating surplus from the harvest of timber resources (after taking account of taxes and subsidies), less:
1) harvesting expenditures,
2) user cost of produced assets used in the course of harvesting,
3) land rent.
Resource rent can be estimated more directly by the appropriation method, using estimates of the value of the growing stock (stumpage price), which is the amount paid per cubic meter of timber by the harvester to the owner of the timber resources (government).
The common practice in the Russian Federation is the sale of standing timber under lease contracts for timber harvesting or under sale contracts for standing timber. In either case the price per cubic meter of timber is determined by auction and can be used as a measure for deriving estimates of resource rent in timber asset accounts.
Generally, when deriving the monetary estimate of timber assets, the resource life is taken to be unlimited. The estimated felling rate can be used as the measure of allowable timber harvesting volumes. Harvesting in excess of the calculated felling rate should be treated as timber depletion. In any case, the question of whether timber resource life is limited or unlimited is decided primarily by examining trends and rates of reduction of mature timber assets.
In case of limited resource life, if the characteristics of forest plots by age and species are known, the specific timber rent can be multiplied by an estimate of the expected volume of standing timber per hectare, taking account of the expected proportion between timber of harvesting age and yield estimates in future periods. These future receipts are then discounted (over the time from the current period to the expected harvest period) in order to estimate a value per hectare for each age class. In turn, these values are multiplied by the total area of each age class and added to give the value of the total stock of standing timber. This approach should ensure that trees harvested after reaching maturity are separately accounted for.
This approach can only be implemented in the Russian Federation piece-wise, since there is no reliable primary information and the scale of illegal harvesting is considerable. A simplified approach uses the current age structure and assumes that each tree of a particular age grows to maturity and is harvested at maturity.
Taking these points into account, Table 2.18 presents available options for valuing timber resources and aggregating primary statistical and administrative data to derive monetary accounting of timber resources in Russia today.
Table 2.18 Aggregating primary data for monetary asset accounts of timber resources, millions of rubles

Estimation of timber value by the residual value method is based on data from the following reporting forms: OKVED-02.01.1 (Russian Classification of Economic Activities) on logging operations from forms No.P-1 “Information on production and shipping of goods and services,” No.5-3 “Information on cost of production and sale of products (goods, work, services)” and No.P-3 “Information on financial standing of the company.”
The following sources of information can be used to estimate rent from timber harvesting by the appropriation method:
- form 13-OIP “Information on auction sale of rights to lease forest plots,” column 4 “timber harvesting,” the value from column 10;
- form 14-OIP “Information on forest plantation sale agreements,” column 10.
The figures obtained present the specific share (rubles/cubic meter) of timber rent accrued to the government in the accounting period based on the results of auctions for standing timber sale under forest leasing and sale agreements.
Non-timber forest products
Unlike timber or mineral resources, the SEEA 2012 does not provide details regarding forms and algorithms for accounting non-timber forest products as a separate type of natural resources. Within the SEEA classification, non-timber forest products are included in “Other biological resources (other than timber and aquatic resources)” (UN, 2012a, p. 147).
While the vast majority of biological resources are cultivated, there is a range of natural (non-cultivated) biological resources that provide inputs to the economy and form an important part of local biodiversity. These resources may include wild berries, fungi, fruits and other plant resources that are harvested for sale or own consumption.
Physical accounting
The structure of the asset account for non-timber forest products is presented in Table 2.19.
Table 2.19 Sample of the physical asset account for non-timber forest products87
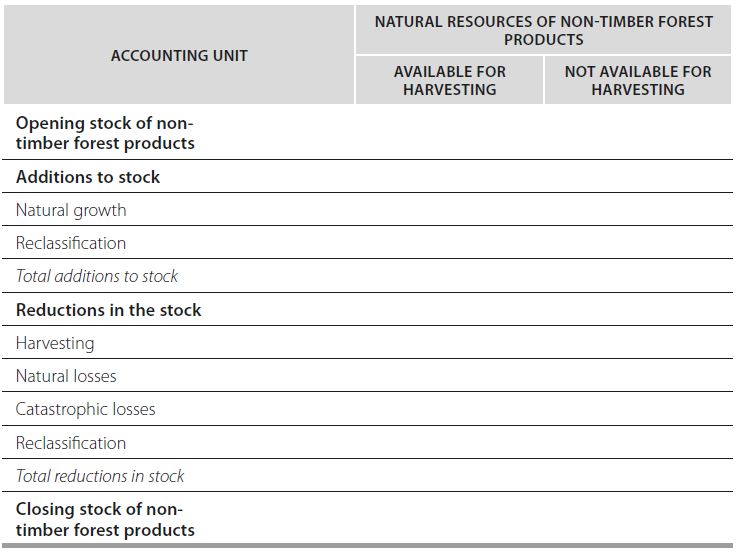
Source: UN, 2012a.
Stock of resources
The stock of non-timber forest products, both available and unavailable for supply, is defined as the quantity of the products within the boundaries of the reference territory at a given point in time (beginning or end of an accounting period).
The yield of various types of non-timber forest products is divided into gross and operational. Gross harvest is the biological harvest of non-timber forest products, while the operational harvest is the commercially feasible harvest taking into account transportation availability, funding, human resources and accessibility of the territory in terms of relief (Sudiev & Novikov, 1976). So the estimate of the stock of non-timber forest resources is composed of:
a) non-timber forest resources available for supply: the amount of the operational harvest, taken, as a rule, to be a certain percentage of the biological harvest in the reference territory;
b) non-timber forest resources unavailable for supply: the difference between the biological and operational harvest in the reference territory.
This indicator is not currently recorded in reporting forms of statistical and administrative accounting. Some primary information on the stock of non-timber forest products can be found in specialized research publications.
Additions to stock
Natural growth is measured as the annual increase in the operational harvest of the product over an accounting period. It should be recorded as the positive value of the sum of the actually harvested non-timber forest products by species over the accounting period and the increase in their operational harvest in the same period for any natural reason (e.g., increased share of berrying grounds in the total area of the reference territory, etc.), excluding increases due to: land reclassification (e.g., transfer from protected natural area to exploitable forest, etc.), and changes in forest management practice entailing transfer of non-timber resources from natural resources to cultivated and vice versa.
This indicator is not currently recorded in reporting forms of statistical and administrative accounting. Some primary information on natural additions to the stock of non-timber forest products can be found in specialized research publications.
Reclassification is the increase in the volume of timber resources over an accounting period due to:
- increase in the area of forest and other wooded land resulting from their transfer to other land categories;
- changes in forest management practice entailing transfer of non-timber resources from natural resources to cultivated and vice versa.
This indicator is not currently recorded in reporting forms of statistical and administrative accounting. Some primary data on increase of the stock of non-timber forest products due to reclassification can be found in specialized research publications.
Reductions in the stock
Harvesting is the volume of actually harvested non-timber forest resources by species over an accounting period. This indicator is registered in reporting forms of statistical and administrative accounting in area units (hectares), except for soft resin. For soft resin, the estimate can be derived using data in statistical reporting forms:
- 2.3 State Forest Register “Use of forests by individuals and legal entities,” column 16 “Harvesting of soft resin, tones.”
- 24-OIP “Information on the use of forest plots leased, granted in perpetuity, provided gratis, provided for a limited period,” column 4, lines: “Soft resin harvesting,” “Harvesting of non-timber forest resources,” “Harvesting of food forest resources and gathering of medicinal plants.”
Primary data on harvesting of non-timber forest resources using weight or volume units (kg, m3) can be found in the results of specialized research projects or in household economy surveys.
Natural losses are losses of the non-timber forest product harvest during an accounting period due to mortality and causes other than harvesting. Examples include mortality due to natural causes, insect attack, fire, etc. Natural losses only include those losses that can be reasonably expected when considering non-timber forest resources as a whole. Catastrophic losses should be recorded when there are exceptional and significant losses of non-timber forest resources due to natural causes.
This indicator is not currently recorded in reporting forms of statistical and administrative accounting. Some primary information on natural and catastrophic losses may be found in specialized research publications.
Reclassification is the reduction of the volume of the operational harvest over the accounting period due to:
- decrease in the area of forest and other wooded land resulting from their transfer to other land categories;
- changes in management practice that shift non-timber resources from natural to cultivated and vice versa.
This indicator is not currently recorded in reporting forms of statistical and administrative accounting. Some primary data on reduction of the stock of non-timber forest products due to reclassification can be found in specialized research publications.
So there is an acute overall shortage of primary data for physical asset accounting of non-timber forest products. Only partial data are available for this type of natural resources, notably data for harvesting of soft resin (tones/year). Harvesting of all other non-timber resources is recorded as a single estimate, i.e., the area of harvesting of all types of products (table 2.20). No physical indicators of other types of non-timber resources can be found in the existing forms.
Table 2.20 Aggregating primary data for physical asset accounting of non-timber forest products88

Whether and to what extent the existing information gaps are to be completed should be determined based on importance of the missing data for assessment of the state, sustainability and efficiency of use of the stock of specific types of non-timber forest products.
Monetary accounting
Monetary valuation of non-timber forest resources assumes resource life to be unlimited (as in the case of timber resources). Otherwise, the limited or unlimited nature of resource life is decided primarily by examining certain perceived and specifically conditioned trends and rates of reduction of the stock of non-timber forest resources. Aggregating of primary data for monetary asset accounting of non-timber forest products is shown in Table 2.21.
Table 2.21 Aggregating of primary data for monetary asset accounting of non-timber forest products, million rubles.
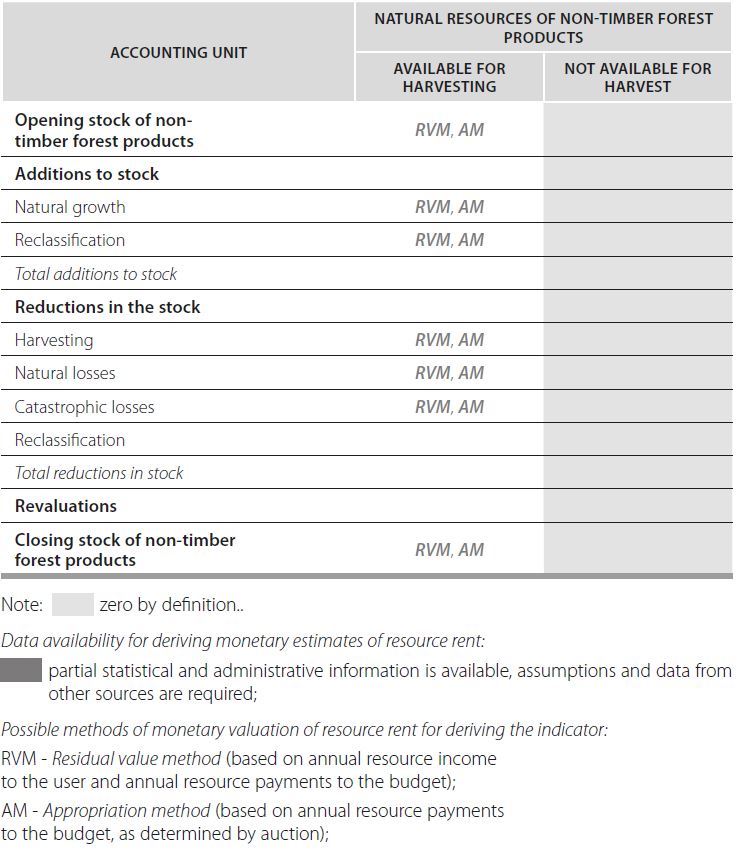
Application of the residual value method is based on data from the following reporting forms: OKVED-02.01.2 (Russian Classification of Economic Activities) on harvesting wild and non-timber forest products from forms No.P-1 “Information on production and shipping of goods and services,” section 2, No.5-3 “Information on cost of production and sale of products (goods, work, services)” and No.P-3 “Information on financial standing of the company.”
The following statistical forms can be used in order to apply the appropriation method in respect of non-timber forest resources:
- form 13-OIP “Information on auction sale of the right to lease forest plots,” column 4 “Harvesting soft resin,” “Harvesting and gathering non-timber forest resources,” “Harvesting food forest resources and gathering medicinal plants”: values from column 10 are to be multiplied by the respective values in column 6;
- 16-OIP “Information on forestry income and its distribution among beneficiaries,” lines “Harvesting and gathering non-timber forest resources” and “Harvesting food forest resources and gathering medicinal plants,” column 7.
The value derived is the annual amount of the share of non-timber forest resource rent accruing to the government in the accounting period following auction sale of non-timber forest products under forest leasing agreements.
Animals
At the present time, only hunting of animals and birds is covered by statistical monitoring and administrative accounting in the Russian Federation. This is explained by the stable demand for these resources, relative economic significance of these resources at local and regional level and the need for measures, by which government authorities can control, regulate and preserve their populations. So the accounting of hunting species is established and maintained for the purpose of sustainable environmental management in the reference territory.
The lack of demand for other types of fauna means that there is no immediate threat of critical reduction of their population due to hunting in the reference territory, so regular statistical accounting of their populations appears to be unnecessary. It would be advisable to develop a structure and system of forms for physical accounting of other animal resources (by species) for purposes of sustainable environmental management in the reference territory. This would be useful, e.g., in situations where there is high demand for information on:
- sustainability of the population of hunting species in the reference territory (e.g., to record their population as food supply for predators, as infection carriers, etc.);
- the ecosystem of the reference territory (e.g., species populations as related to environmental pollution, etc.)
In view of these points, we suggest the following arrangement and implementation of environmental-economic indicators for hunting resources.
Physical accounting
The sample physical asset account for animal resources will have the form given in Table 2.22.
Table 2.22 Sample form for the physical asset account for animal resources, individuals
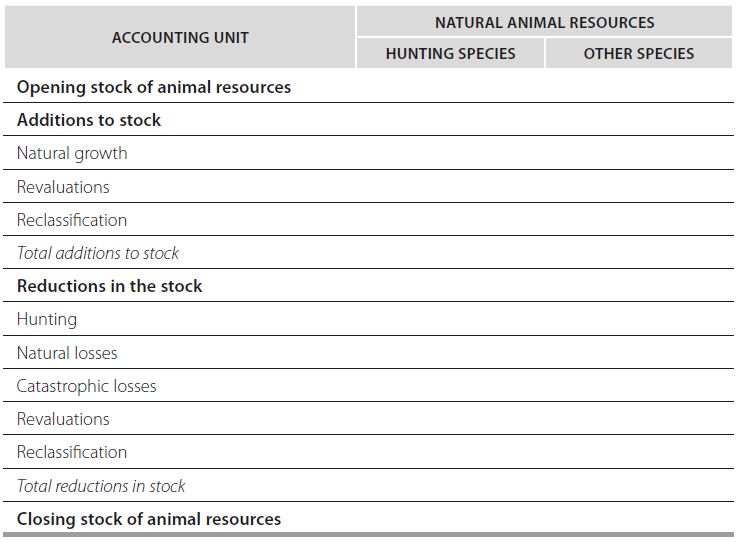
Source: UN, 2012a.
Stock of resources
The stock of hunting resources is defined as the quantity of individuals of each species within the boundaries of the reference territory at a given point in time (beginning or end of an accounting period). The indicator can be derived using data in the following reporting forms:
- form 1.1. (Mammals) “Documented information on the quantity of hunting resources (mammals),” line “Total for the Russian constituent entity,” columns 3- 65;
- form 1.2. (Birds) “Documented information on the quantity of hunting resources (birds),” line “Total for the Russian constituent entity,” columns 3- 72;
- Table 3.3 “Information on take of hunting resources subject to a hunting quota,” column 2 (Order issued by the Russian Ministry of Natural Resources (January 28, 2011, No.23), “On Approval of Requirements for Contents, Reporting Forms and the Procedure for Submitting Reports on Exercise of Powers delegated by Government in the Sphere of Hunting and Hunting Resource Preservation”) (Registered by the Russian Ministry of Justice on March 17, 2011, No.20159);
- Table 3.4 “Information on take of hunting resources that are not subject to a hunting quota,” column 2 (Order issued by the Russian Ministry of Natural Resources (January 28, 2011, No.23), “On Approval of Requirements for Contents, Reporting Forms and the Procedure for Submitting Reports on Exercise of Powers delegated by Government in the Sphere of Hunting and Hunting Resource Preservation”) (Registered by the Russian Ministry of Justice on March 17, 2011, No.20159).
Additions to stock
Natural growth of hunting resources is defined as the increase in the population of species by type in the boundaries of the reference territory due to natural causes, i.e., reproduction and migration, as of the end of the accounting period. Reproduction is taken to be equal (with the opposite sign) to the volume of actual take of hunting resources by species.
The scope of migration is not explicitly recorded in the existing reporting forms. It can be calculated as the positive difference between the quantity of hunting resources by species at the beginning and end of the accounting period, taking account of all other entries for positive and negative changes in the assets during the accounting period
Revaluation is the increase in the total stock of hunting resources during an accounting period due to changes in data on the quantity of the species obtained from additional field studies and/or the application of new accounting techniques. This estimate is not registered as a separate value in the reporting forms of statistical and administrative accounting. Some primary data on increase in the stock due to reclassification can be found in specialized research publications.
Reclassification is the increase in the total quantity of hunting resources during an accounting period due to the reassignment of some species (including Red Book species) to the category of game animals. At present, the indicator should be recorded in forms of statistical monitoring and administrative accounting that are used to derive estimates of the stock (see above).
Reductions in the stock
The “take” of animals and birds is the quantity of individuals of the hunted species, which are killed by hunting during an accounting period. The indicator can be derived using data in the following reporting forms:
- form 4.1. (D-Hoofed) “Documented information on hunted hoofed animals categorized as hunting resources,” line “Total for the Russian constituent entity,” columns 9, 10-18;
- form 4.2. (D-Fur) “Documented information on hunted fur animals categorized as hunting resources,” line “Total for the Russian constituent entity,” columns 4 and 6;
- form 4.3. (D-Birds) “Documented information on hunted birds categorized as hunting resources,” line “Total for the Russian constituent entity,” column 10;
- form 4.4. (D-Wolf) “Documented information on hunted wolves,” line “Total for the Russian constituent entity,” columns 5, 6-11;
- form 4.5. (D-Bear) “Documented information on hunted bears,” line “Total for the Russian constituent entity,” column 4;
- form 5.3 (RCh) “Documented information on game population control,” columns 6, 7-10;
- Table 3.3 “Information on extraction of hunting resources subject to a hunting quota,” column 5 (Order issued by the Russian Ministry of Natural Resources (January 28, 2011, No.23), “On Approval of Requirements on the Contents, Reporting Forms and Procedure for Submitting Reports on Exercise of Powers Delegated by Government in the Sphere of Hunting and Hunting Resource Preservation”) (Filed with the Russian Ministry of Justice on March 17, 2011, No.20159);
- Table 3.4 “Information on extraction of hunting resources that are not subject to hunting quota,” column 3 (Order issued by the Russian Ministry of Natural Resources (of January 28, 2011, No.23) On Approval of the Requirements to the Contents, Reporting Forms and Procedure for Submitting Reports on Exercising the Powers of Russian Federation Delegated in the Sphere of Hunting and Hunting Resource Preservation”) (Filed with the Russian Ministry of Justice on March 17, 2011, No.20159).
Natural and catastrophic losses of hunting resources are defined as reduction in the population by species for natural causes (i.e., natural mortality, migration, etc.) within the boundaries of the reference territory as of the end of the accounting period. Since the current reporting forms of statistical and administrative accounting do not distinguish information on losses of hunting resources according to the above-mentioned SEEA criteria, it appears expedient to record them as a consolidated estimate in the accounts. The indicator can be derived from the data in reporting form 1.4 (RG), “Documented information on mortality of hunting resources”:
- total: column 3;
- adult: column 4;
- up to 12 months: column 5;
- from disease: columns 6-8;
- road accidents: columns 9-10;
- poaching: 12-14;
- other causes: 15-17.
Revaluation represents reduction in the total stock of hunting resources during an accounting period due to changes in data on the quantity of the species obtained from additional field studies and/or application of new accounting techniques. This estimate is not registered as a separate value in the reporting forms of statistical and administrative accounting. Some primary data on reduction in the stock due to reclassification can be found in specialized research publications.
Reclassification is reduction in the total quantity of hunting resources during an accounting period due to the transfer of some species from the category of game animals to the Red Book. At present, the indicator should be recorded in forms of statistical monitoring and administrative accounting that are used to derive the indicator of stocks.
To summarize, the most complete information on hunting resources are given by the indicators, “Stock of resources,” “Take” and “Reclassifications” (Table 2.23).
Table 2.23 Aggregating primary data for physical asset accounting of hunting resources, individuals
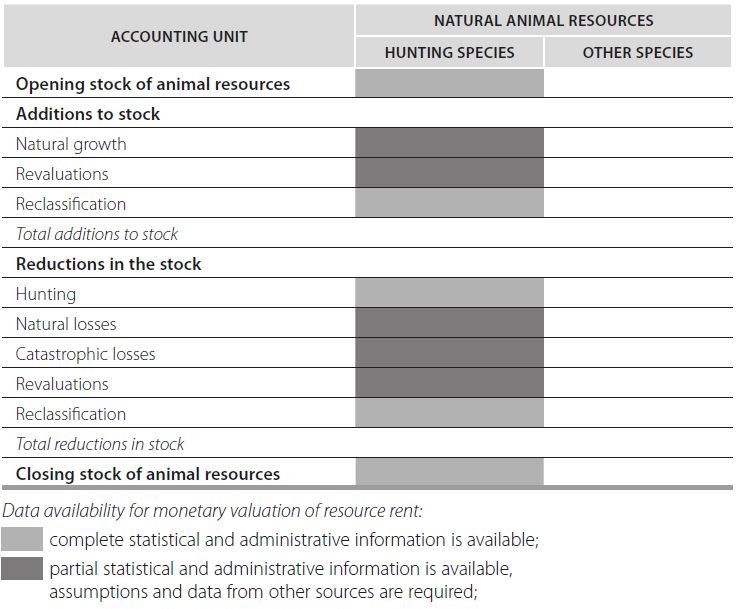
Natural growth is not recorded as a separate estimate in the existing systems of statistical monitoring and administrative accounting. Its derivation by the balancing method (difference between receipts and expenditure) presupposes animal migration. Separate accounting for these estimates is required in the existing reporting forms to distinguish between natural and catastrophic losses.
Monetary accounting
Resource rent from the take of hunting resources can be calculated by the residual value method using OKVED-01.5 Wildlife hunting and breeding, which includes the respective services, from reporting forms P-1, “Information on production and shipping of goods and services” (section 2), 5-3, “Information on the cost of production and sale of products (goods, work, services)” and No. P-3, “Information on financial standing of the company.” However, the results obtained will only partially cover activities in this sphere because most economic actors are sole traders or small businesses and are not recorded in the statistical reports mentioned above. Hunting costs and profits with respect to the above categories of hunters are derived from form No.2-TP (hunting), “Information on hunting and game management”: line 28 of section 4 less line 7 of section 2 (ignoring the values in line 14). In both cases the result obtained gives the total figure for resource rent of hunters without breakdown into hunted species, which reduces the analytical power of the accounting.
A similar drawback is inherent in the calculation of hunting resource rent by the access price method. It is based on the final price of auctions of rights to make contracts for the use of specific hunting grounds. Payment for the land where the hunting grounds are situated is not included in the auction lot. To apply this method, we need inputs from Table 6.1 Information on holding auctions for the right to enter into hunting contracts, column 3 (Order issued by the Russian Ministry of Natural Resources, dated January 28, 2011, No.23, “On Approval of Requirements on the Contents, Reporting Forms and Procedure for Submitting Reports on Exercise of Powers Delegated by Government in the Sphere of Hunting and Hunting Resource Preservation”).
Monetary valuation of the rent on specific types of hunting resources can be obtained by the appropriation method using the data of the Russian Tax Code (part two), dated August 5, 2000, No.117-FZ (as amended on July 21, 2014), Art.333.3 on the rates of duty for the use of wildlife. The asset account for animal resources in monetary terms is given in Table 2.24.
Table 2.24 Aggregating primary data for monetary asset accounts of hunting resources, millions of rubles
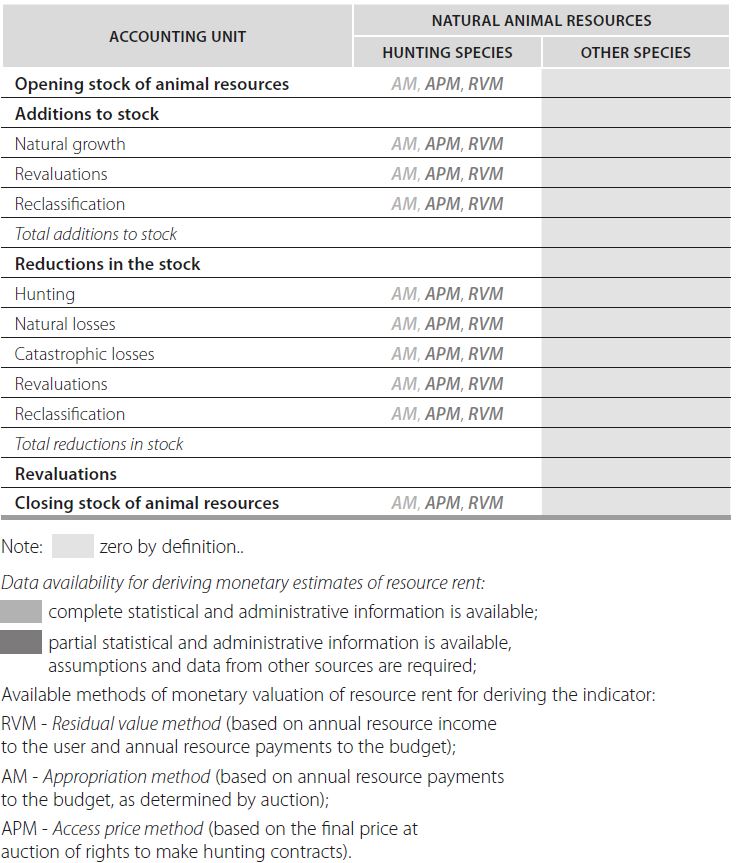
The resource life of the stock of game animals is, as a rule, taken to be unlimited. The permissible take may be based on quotas for hunting of specific species in the reference territory. Take in excess of the hunting quota should be treated as depletion of resources. Whether the resource life of game stock is limited can be decided by examining trends and rates of reduction in the population of game species.
Air emissions, discharges into water bodies and solid waste disposal are defined in the SEEA 2012 as materials discharged by enterprises into the atmosphere, water or soil as a result of production, consumption and accumulation processes. Therefore, the focus in emissions accounting is not on the complete cycle of the particular pollutants through the economy, but on the flow from the economy to the environment.
We will examine physical flow accounting for air emissions, discharges to water and solid waste disposal as regards the availability of statistical, administrative and other primary data.
Air emissions account
The air emissions account (Table 2.25) is compiled on the basis of primary data on the volume of emissions by economic units, by type of polluting substance. The left-hand part of the table shows the generation of emissions from industries and households by type of substance.
To complete the left-hand part of the table, “Generation of gross releases,” we can use data from form No.2-TP, “Information on atmospheric air protection.” However, the information obtained from this form does not include emissions from personal transport (cars) and fails to give any idea of other possible air emissions from households. A similar situation obtains for emissions from landfills as regards the part of emissions from solid waste accumulation. These estimates can be obtained from other available sources of information (environmental monitoring, expert reports, etc.)
Table 2.25 Air emission account (tones)
Supply table for air emissions Use table for air emissions
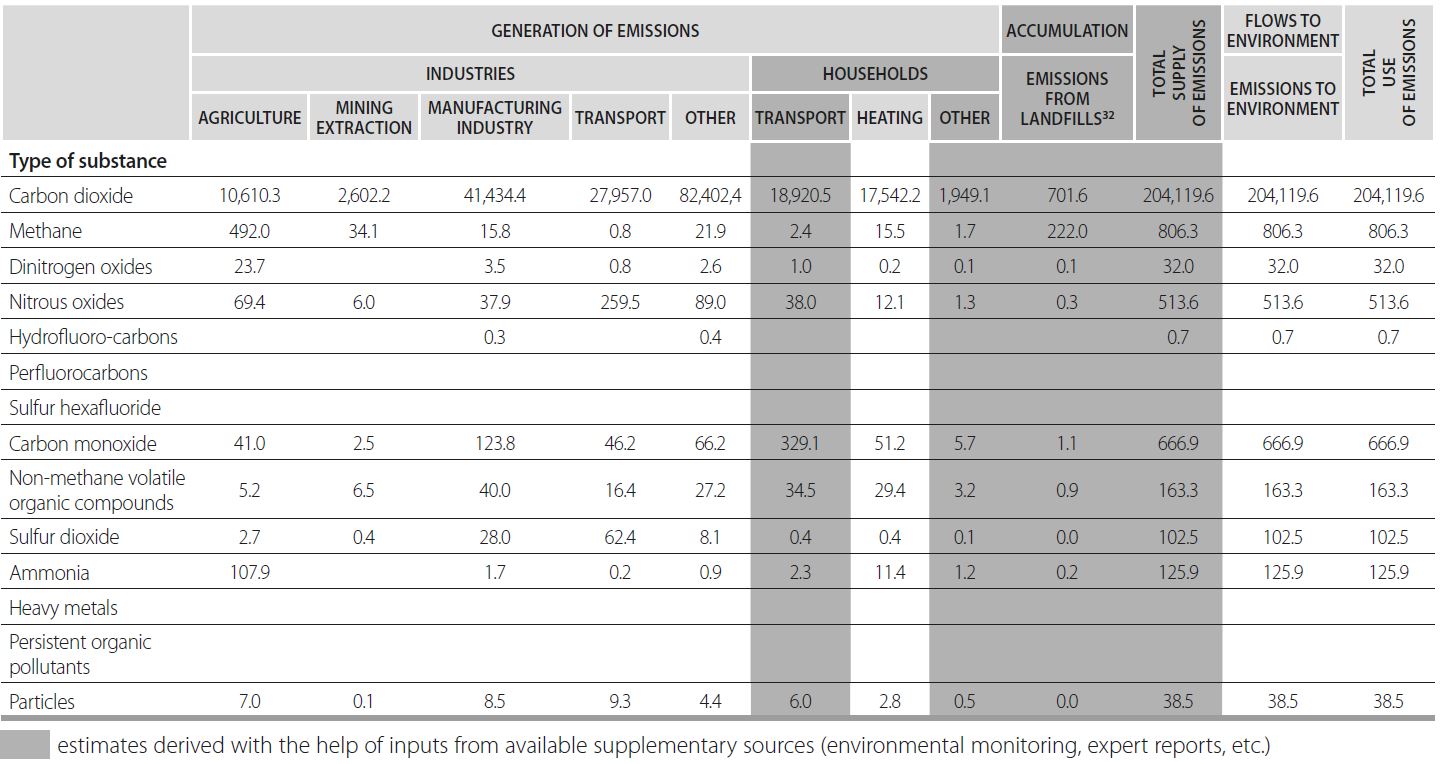
Source: UN, 2012a, p. 88.
Accounting of discharges into water bodies
The SEEA framework takes account both of direct releases of pollutants to water resources from economic units (establishments and households) and releases of pollutants to water resources via the sewerage system, where the releases are received, treated and cleaned. So the accounting system covers gross releases of pollutants by establishments and households to water resources and to the sewerage system (Table 2.26).
Table 2.26 Structure of water emission accounts (tones)
Physical supply table for gross releases of substances to water
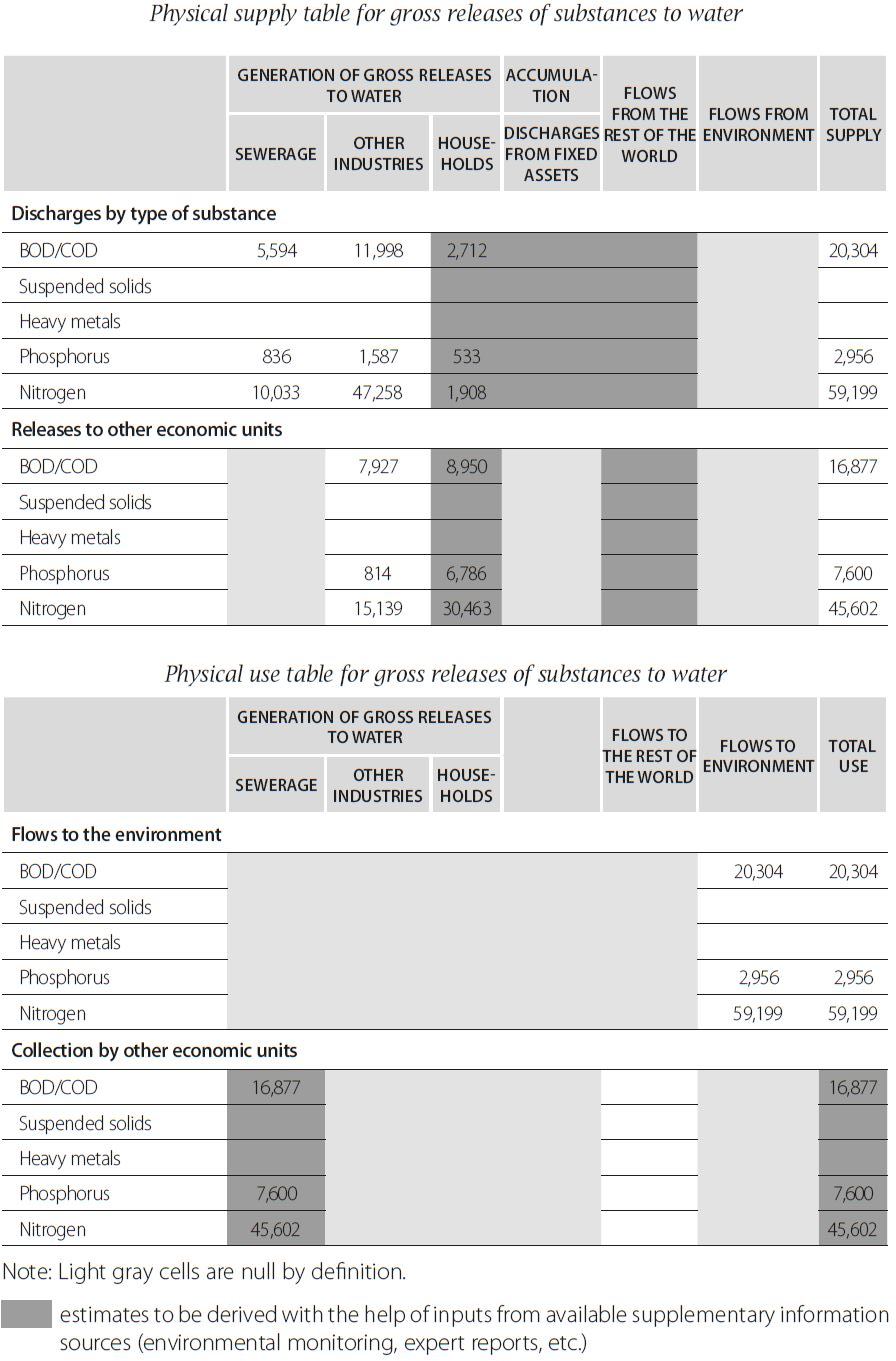
Note: Dark gray cells are null by definition.
- estimates to be derived with the help of inputs from available supplementary information sources (environmental monitoring, expert reports, etc.)
Source: UN, 2012a, p. 93.
The table can be compiled using data in reporting form No.2-TP (water management), “Information on water use.” However, it should be noted that this reporting form does not record substances transferred with wastewater for treatment (“to the sewerage system” in the SEEA terminology), but only accounts for substances released directly to water bodies (with or without previous treatment). Also, according to the final paragraph of point 3.13. of the Guidelines for completion of forms of federal statistical monitoring No.2-TP (water management), “...in recording polluting substances, account is taken only of the amount of substances released to the water body as a result of using the water (the total quantity of substances contained in the releases is reduced by the quantity of substances contained in the water taken from the same water body).”
So the cells of the subsections “Discharges by type of substance” and “Discharges to environment” (except for “Households”) can be partially filled in using the data of reporting form No.2-TP (water management). Completion of the cells in the sections, “Releases to other economic units” and “Collection by other economic units” as well as all sections of the columns, “Households,” “Flows with the rest of the world” and “Flows to the rest of the world” will require reference to inputs from other available sources.
Solid waste account
Solid waste consists of discarded materials that are no longer required by the owner or user. Where the unit discarding the materials receives no payment for the materials, the flow is considered being a residual flow of solid waste. Where the unit discarding the materials receives a payment, but the actual residual value of the material is small (e.g., scrap metal sold to a recycling firm), this flow is considered being a product flow in the form of solid waste (UN, 2012a, p. 94).
The structure of the solid waste account is presented in Table 2.27. Since there is no standard international classification of solid waste, the table includes, for illustrative purposes, an indicative listing of types of solid waste based on the statistical version of the European Waste Catalogue (EWC-Stat).
Table 2.27 The structure of the solid waste account (tones)
Physical supply table for solid waste
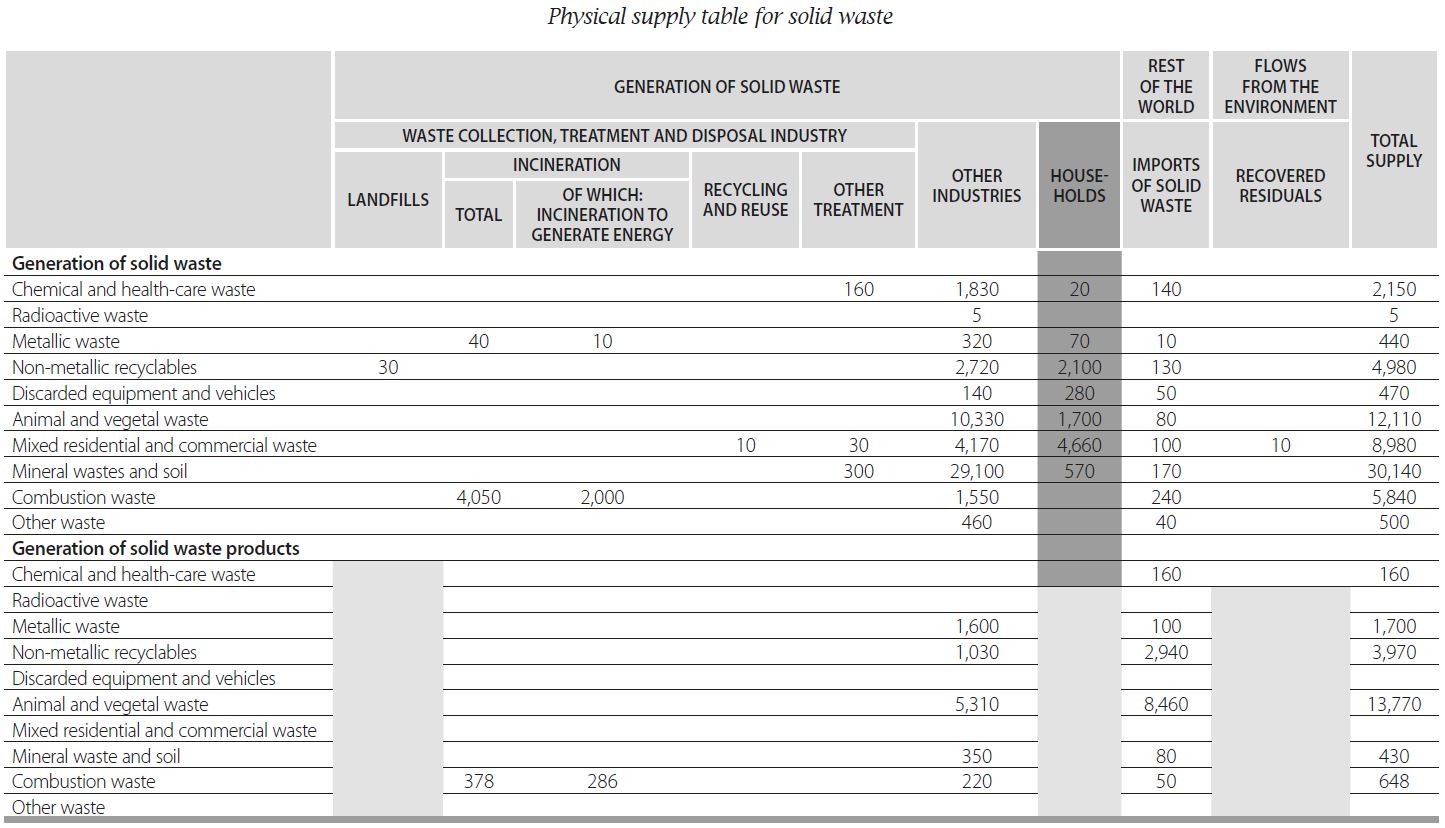
Note: Dark gray cells are null by definition.
Physical use table for solid waste

Note: Dark gray cells are null by definition.
Source: UN, 2012a, pp.96-97.
The upper half of the table is the supply table whose first part, covering “Generation of solid waste residuals,” shows the generation of solid waste by industries and households. It also shows the supply of solid waste from the rest of the world (recorded as imports) as well as solid waste recovered from the environment (e.g., oil recovered following an offshore oil spill, debris collected following a natural disaster; or excavation of soil from locations where hazardous chemicals were used).
The bottom half of the table is the use table, whose first part, covering “Collection and disposal of solid waste residuals,” shows the collection and disposal of solid waste by the waste collection, treatment and disposal industry and by related activities in other industries. It also shows the flow of solid waste to the rest of the world as exports and the flow of solid waste direct to the environment.
The second part of the supply table, “Generation of solid waste products.” and the second part of the use table, “Use of solid waste products,” record flows of solid waste that are considered being products rather than residuals. The flows recorded here relate to instances where a solid waste product is identified at the time of disposal by the discarding unit. The flow is recorded in the second part of the supply table and is matched by a use of solid waste products in the second part of the use table. This ensures recording of the sale of scrap metal and other products, which have lost their consumption properties.
Sales of products manufactured from solid waste or simply obtained from waste collection are not included in this table. For example, paper discarded by households, which is collected by a charity organization and subsequently sold in bulk to a paper recycling firm, is recorded in the solid waste account only in respect of the initial flow of solid waste from households to the charity organization.
Practically all cells of Table 2.27 can be completed on the basis of data in reporting form No.2-TP (waste), “Information on generation, use, treatment, transportation and disposal of production and consumption waste.” However, that does not include data required for completing the “Households” item.
* * *
The required primary statistical information is generally available for material flow accounts regarding atmospheric emissions, discharges into water bodies and solid waste residuals. The account data are derived from the performance indicators of economic units by sector and by specific substance and type of waste. The most complete information among the physical flows related to environment pollution, which are considered above, is for the solid waste account. The common failing of all accounts is the absence of data related to household activities. In this context expert information that can be used for deriving environmental-economic estimates acquires great importance.
The SEEA envisages presentation of a wide variety of facts and phenomena regarding the activities of economic agents (various legal entities, unincorporated entities, households, etc.), government authorities and local government bodies for purposes of environmental protection and resource management. This necessitates the completion and maintenance of accounts reflecting environmental protection expenditure, performance of producers of environmental goods and services, resource management expenditure, etc. Such information provides a basis for efficient environmental management that promotes green growth and development of the green economy.
The SEEA defines environmental protection services as products that are typical of environmental activities. They include environmental protection services produced by economic units for sale or for their own use, e.g., services for the removal and recycling of solid waste residuals, wastewater removal and treatment.
The environmental protection service accounts (EPEA) and the resource management expenditure accounts have a similar structure (table 2.28). Production of environmental protection services is presented with a breakdown between specialist producers, non-specialist producers and own-account producers. Government specialist producers are separately identified.
Table 2.28 Structure of accounts for environmental protection services and resource management expenditure accounts (monetary units)
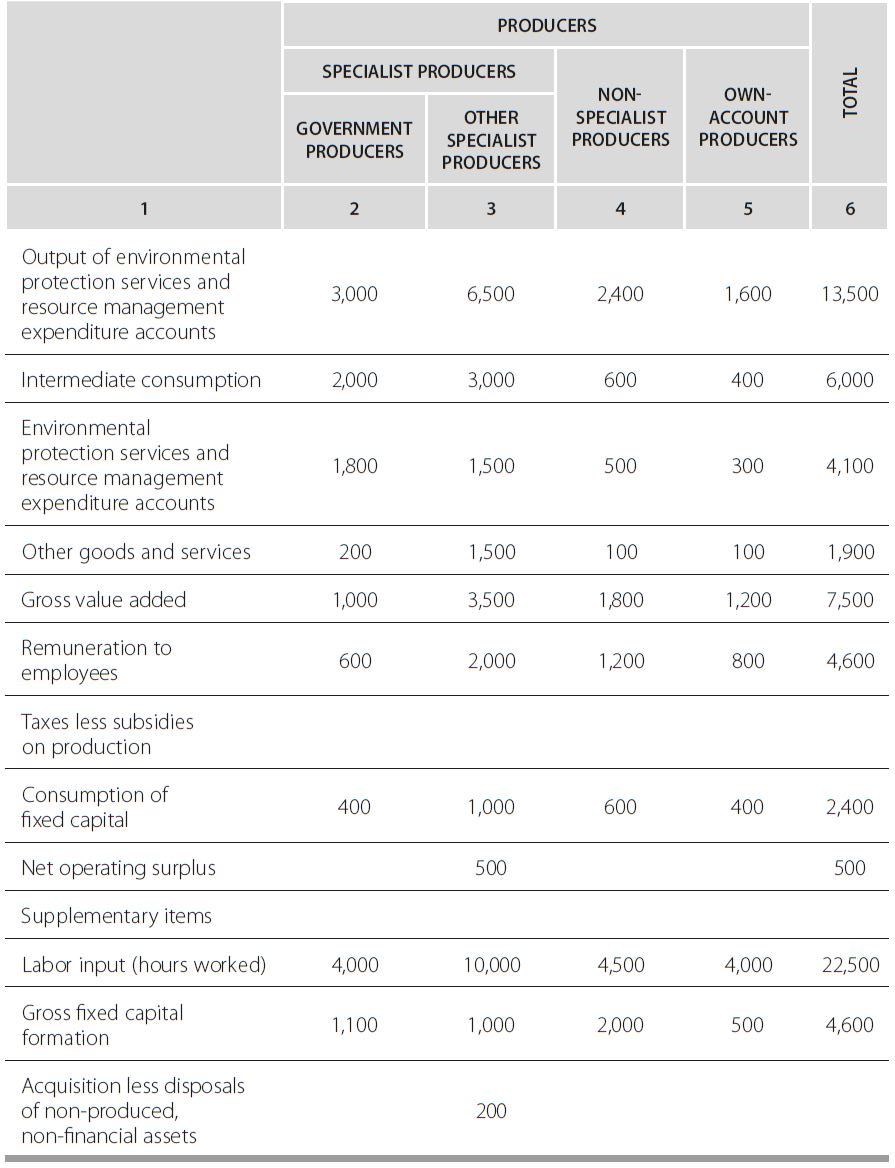
Source: UN, 2012a, p. 111.
Specialist producers in the EPEA are establishments whose primary activity is the production of environmental protection services. Non-specialist producers are those establishments that produce environmental protection services as secondary outputs, but have a different primary activity.
Resource management expenditure accounts comprise accounts covering the supply and use of resource management services, national expenditure on resource management and financing of national expenditure on resource management. It may be relevant to compile resource management expenditure accounts for a specific type of resource (e.g., timber resources or water resources) (UN, 2012a, Chapter 4).
Russian statistics organize main environmental protection expenditure data in form No.4-OS, “Information on environmental protection expenditure and environmental fees.” However, the format of presentation of environmental protection expenditure in this reporting form differs from that of Table 2.28. For example, form No.4-OS does not contain information that would enable the breakdown of economic units into specialist and non-specialist producers of environmental services and does not identify own-account producers of such services. Therefore, compilation of environmental protection expenditure accounts in accordance with the above structure will require information from other available sources on environmental services and resource management expenditure in order to derive main economic indicators for these activities (Table 2.28, column 1) and main groups of producers (Table 2.28, columns 2-5).
Accounting of transactions that involve fixed assets used in economic activities related to the environment should be separately mentioned. There is often reason to be interested in fixed assets used to extract and harvest natural resources, and in the value of investments in fixed assets for environmental protection or resource management. For example, information on the amount of investments in equipment to capture energy from renewable energy sources may be of interest. The SEEA does not define aggregates for environment-related fixed assets. Rather, the measurement scope will depend on the economic activities, which are of interest. For example, fixed assets related to environmental protection expenditure will cover any specialized equipment purchased and also expenditure on more generic assets such as buildings, cars, computers, that are required by specialist producers of environmental protection services. In all cases, the accounting treatment of fixed assets should follow the treatments outlined in the SNA. These assets are included in the accounts for other environment-related transactions (economic activity for environmental purposes).
In Russia, the respective estimates can be derived using data in reporting form 18-KS, “Information on capital investments in environment protection and resource use.” However, the format for collection and presentation of such data differs from the account structure and requires the use of other available information sources.
Thus, functional accounts for other transactions related to environmental-economic activities can be compiled using the data on environmental protection expenditure in forms No.4-OS, “Information on current environmental protection expenditure and environmental fees” and 18-KS, “Information on capital investments in environmental protection and resource use.” However, the format of the data presentation differs from that in the accounts for production of environmental protection services and resource management expenditure accounts, because the above reporting forms do not contain data that enable breakdown of the economic agents between specialist and non-specialist producers of environmental services and do not identify own-account producers. Also, there is no statistical accounting for expenditure on resource management and the environmental goods and services sector. To summarize, the framework of primary data on environmental management is not oriented to integrated accounting of these activities in the main indicators of accounts for production, distribution and use of income and therefore fails to assess the role of these activities in deriving the indicators of these accounts.
USE OF SEEA APPROACHES TO ADDRESS KEY TASKS OF ENVIRONMENTAL MANAGEMENT
The SEEA methodology is a significant part of present-day statistics. As the ideas of sustainable development gain ground, the system-forming role of the SEEA becomes more evident due to its treatment of environmental resources and ecosystem services from the viewpoint of their value for territories and the people who live there. As noted above, the SEEA analyzes three main flows: products (goods and services produced in the economy and used within it), natural resources (inputs) (mineral and energy resources, soil, water and biological resources) and residuals (unintended and undesirable outputs of the economy, which can be reused or returned to the environment, including solid waste, wastewater and gaseous emissions into the atmosphere)
Flow accounts are compiled in the form of supply and use tables. The basic table is compiled in physical terms and characterizes the relative significance of different economic activities in the context of their impact on the environment. The benefit of this approach is the possibility of compiling integrated (“hybrid”) supply and use tables where monetary values are shown alongside their equivalents in physical terms, with a balancing item that expresses value added. Hybrid tables have been used to study various ecological issues, such as the greenhouse effect or solid waste residuals. Asset accounts are used to reflect the stocks and changes in the stocks of natural resources in both physical and monetary terms. The fact that physical asset accounts are also compiled for resources that are not evaluated in monetary terms and hence are not reflected as assets in the SNA, e.g., air, water, etc., is of critical importance.
Drawing on our experience in research work and consultancy, we came to the conclusion that even at a time when Russia has not fully implemented the SNA and SEEA, many of their methodological approaches and techniques can be put to good use in solving the practical goals of resource use and environmental protection. First of all, it is important to emphasize their versatility and the possibility of compiling “white” (based on official statistical and administrative data) and “gray” (including shadow-economy data) matrices of environmental-economic accounting, in accordance with the Handbook for the SEEA (UN, 1993b) where these issues are considered in great detail. This approach enables a comprehensive evaluation of the natural capital of a territory with a specific tolerance (so far as the input data permit). The results obtained are useful for: strategic planning (including adjustments in GDP and GRP); assessment of the efficiency of economic mechanisms for environmental regulation (taxes, fees, duties, etc.); assessment of investment projects (particularly external ones) for a region or a territory; calculation of damage compensation; validation of the efficiency of environmental plans and investment programs for environmental protection; and conflict management in the areas of resource use and environmental protection.
Another important feature of the SEEA is the establishment of uniform basic approaches to monetary evaluation of environmental resources and ecosystem services, which makes it possible to compare the results obtained. This solves one of the main problems in selecting the most economically beneficial option for environmental management in a specific territory, e.g., choosing between creation of a sand quarry or a beach; starting gold extraction or preserving a salmon breeding site, etc. Moreover, the SEEA allows application of the provisions of the theory of utility and total economic value. This is essential for implementation of the principles of sustainable development.
First of all, it is known that a large part of resources is used by the government and the population, who do not obtain full return on the resource exploitation; this often testifies to market underestimation of returns on environmental resources and ecosystem services. Such undervaluation needs to be stopped. Secondly, there are various resources that provide services, which have never been evaluated. These resources need to undergo initial valuation. Thirdly, economic activities can damage the environment. The damage might affect current and future services provided by natural resources. Consequently, such activities should also be viewed negatively. The fact is that some resources are being depleted and hence lost for future generations, who will not have access to the same resource base. In these cases adjustment has to be made for depletion. Often the existence value of a resource needs to be taken into account. This is particularly true with respect to natural and cultural heritage sites and recreation sites. Existence value is not directly related to the value of the resource’s present use, but reflects its inherent value.
It should be emphasized that widespread application of SEEA approaches reflects their ability to identify socially dangerous depletion of environmental resources by the use of statistical data. Instrumentally, this is connected with the rules and standards of the World Trade Organization for ensuring equal access to markets. Though the WTO/GATT documents in force (including annex 1A GATT-94 and annex 1B GATS) do not have any special provisions on trade in natural resources, there are some environment-related exceptions. Thus, e.g., WTO/GATT does not prevent its participants from adopting policies “relating to the conservation of exhaustible natural resources,” but subject, however, to the requirement that such measures would not constitute a “hidden limitation of international trade” or a “discriminatory” measure; the policies must be used together with a limitation of domestic production or consumption (art.XX(g) WTO/GATT Agreement) This fact is of great importance for countries whose economies are highly oriented to resources, because proof of territory-specific and socially dangerous depletion of the stock of a certain natural resource is precisely what enables the adoption of tariff and tax regulation to control its extraction by an external consumer.
Guided by these considerations, we have decided to provide a few of the most telling examples of the use of SEEA methods in Russia and its regions. These cases of best practice have been selected to demonstrate the applicability of SEEA approaches for improving government regulation of resource management and environmental protection. The authors have selected the most interesting practices, which serve efficient modernization for transition to the “green” economy and sustainable development in Russia and its regions. The case studies given below are based on published materials. These stories recount only those parts of the published materials that are directly related to the SEEA agenda. All descriptions, comments and interpretations of the results and conclusions are laid out as worded in the publications at the time of their issuance.
Russia is the world’s largest country, so the development of SEEA/SNA accounting exclusively at federal level, without delegating powers to territories, does not appear to be the optimal solution for sustainable development of the country and its regions. From the point of view of macro-analysis at the federal level, it might at first seem reasonable to use only a “top-down” approach, where aggregate resource valuation in physical terms across the Russian Federation is carried out, followed by monetary valuation at the same level. Such valuation is certainly of great current interest, in view of the fact that main rent flows converge in the federal center. Nevertheless, from the position of sustainable development, in view of the great diversity of geographical and social-economic conditions in the Russian regions, such aggregation would not promote the solution of urgent problems of a strategic character (better use of natural resources, employment for the local population, preventing depletion and degradation of the environment). Deriving values solely at the federal level tends to mask important regional and local differences, and the results obtained fail to respond to numerous questions concerning social and economic development and strategic planning of the Russian Federation and its regions, which is the ultimate goal of SEEA/SNA accounting. Consequently, there is fundamental justification for a “bottom-up” approach, where macro-assessments are supplemented by estimates derived at the sub-federal level. Only by generalization of environmental-economic estimates obtained for regions can we obtain a relevant picture at the national level, which would provide unbiased information and help to define an effective strategy of environmental management. Development of the SEEA for the benefit of regional and local governments rather than its limitation to federal decision-making will enhance public regulation of sustainable environmental management in Russia.
Consistent with this methodology and taking account of the broadly perceived geographical conditions in Russia, the experts of the Cadaster Institute have carried out studies of the potential and the specifics of use of environmental-economic accounting approaches in Russia in 2007-2009. The work was carried out at the request of the Russian Ministry of Natural Resources and Environment and supported by the Federal Service for National Statistics (Rosstat). The possibility of systemic compilation of regional accounts (matrices) of environmental-economic accounting and their synthesis at the federal level were investigated experimentally. Specialized software packages were also developed, “Natural Capital” (program registration certificate No.2006612568) and “Natural Capital. Specially Protected Areas (SPAs)” (program registration certificate No.2007610083), which help to complete environmental-economic accounting matrices quickly and efficiently, calculate the economic value of natural resources, and simulate various possible situations (Fig. 3.1).
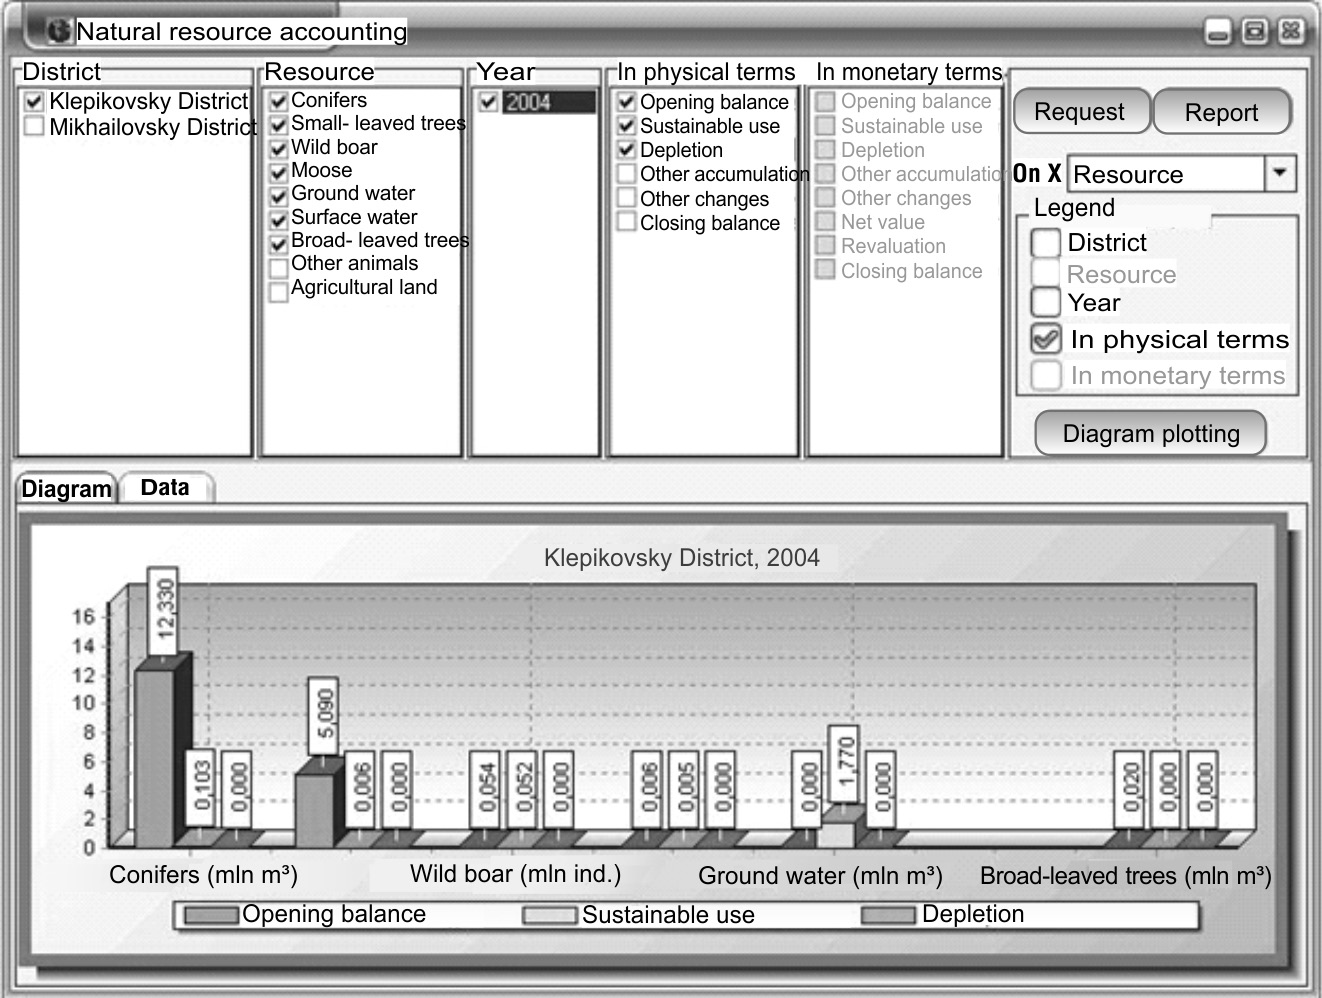
Fig. 3.1 Visualization of the results of analysis of integrated use of natural resources in Ryazan Region (2004).
Overall, the project has shown that information basis for deriving environmental-economic indicators leaves much to be desired. This is largely explained by the lack of demand for such measurements in the 20th century command economy. As mentioned in Section 2.2 above, Russian statistics still account for natural resources in physical terms alone. Monetary information, to the extent that it is available in the statistical accounting, is based on the data of business accounting91 , which (unlike the SNA/SEEA) records land plots and other natural resources as fixed assets. The accounts of budget organizations treat them separately from fixed assets. However, even these estimates are fragmentary (e.g., budget organizations only account for those natural resources, which they have the right to dispose of). Also the available data are not differentiated by type of resource, and the existing information shows highly contingent purchase prices from respective years (the resources have not been revalued since they were acquired).
Having analyzed the existing information base for the valuation of natural resources, including official statistical data (centralized forms of federal statistical monitoring), administrative data (non-centralized forms of federal statistical monitoring and other departmental reporting, data provided by sub-regional government authorities, etc.) and expert data (research projects, publications, expert opinions), we can confirm the availability of data on all groups of natural resources contained in the main items of balance sheet (Table 3.1). However, the information provided in different sources has different status, which complicates its collection and analysis. Most information is available in physical terms; monetary estimates are found only in the system of the Federal Tax Service.
Table 3.1 Information sources for valuation of natural resources
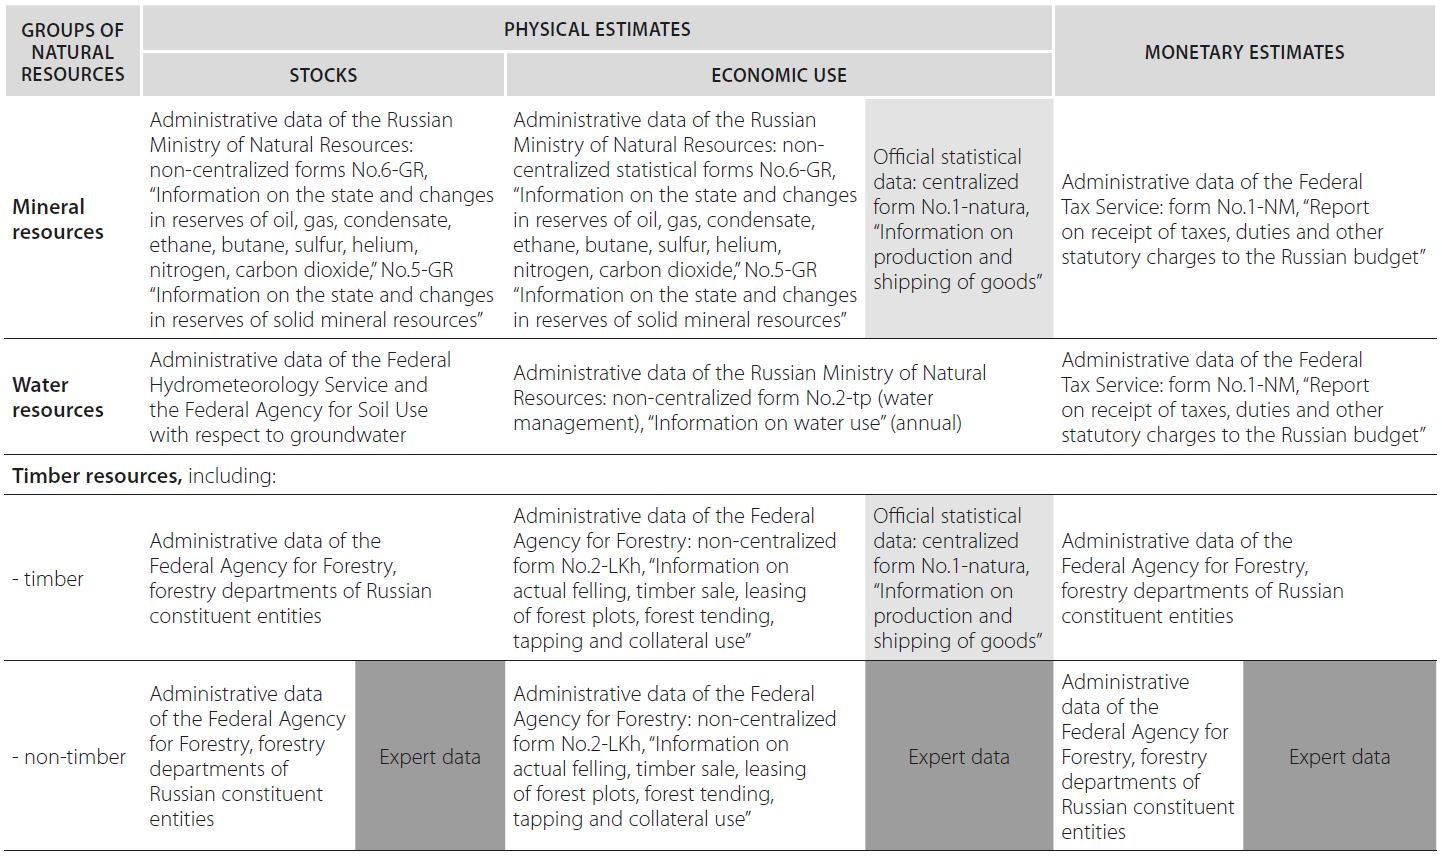

Source: Cadaster Institute, 2007-2009.
The methodology for deriving environmental-economic indicators was provided by the indications given in the SNA: UN documents (Statistics Division, Committee of Experts on Environmental-Economic Accounting, London Group on Environmental Accounting), documents of the OECD/Eurostat, World Bank, International Monetary Fund, as well as the materials of certain foreign projects for the improvement of national accounting systems, methodological and analytical materials of the Federal Service for National Statistics, etc. In the course of the research work, different methods for the collection, processing and analysis of statistical data (calculation, comparative analysis, etc.), and different data visualization and presentation techniques were used.
The valuation of natural resources was carried out by compiling and generalizing matrices (in physical and monetary terms) for Russian constituent entities and then aggregating for the Federation as a whole. Calculations used the software package, “Monetary evaluation of natural resources in the framework of the SNA.”
In accordance with the SNA/SEEA approach, the basis of the approach is compilation of a matrix and derivation of estimates in physical and monetary terms for natural resources to be entered in the matrix cells. The physical estimates that reflect the stock of natural resources and flows of their use, identify the depletion factor and various changes in the stocks (unrelated to economic use), combined in the form of a matrix, are very valuable for environmental management as they help to estimate adequacy of the stock, reveal and forecast physical exhaustion, etc.
The compiled physical matrix provided the basis for deriving monetary estimates, obtained by multiplying physical estimates by the respective monetary measures (market prices, yield rates, etc.). The calculation used different methods, depending on the availability of monetary data:
A) if the resource unit cost was known, the opening and closing stocks were calculated by capitalization of the income gained from the resource using the following equation:
Vt = (pi – ci) x Qi x d, where:
Vt is the capitalized value of the stock calculated for the asset usage period, t, in rubles;
рi is the unit sale price of the resource (or the derived product) within the reference territory or at its borders in the ith year, rubles/unit;
сi is the user’s unit cost of extraction, transportation, processing and sale of the resource (or the product derived) in the ith year, rubles/unit. The indicator is calculated net of any extraction, processing and sale taxes on the resource (or the product derived from it);
Qi is the total annual consumption of the resource in the ith year, unit/year;
d is the discount factor.
The economic use of stocks is calculated as follows:
Vi = (pi – ci) x Qi, where:
Vi is the net annual income from using the stock in the ith year, rubles/year;
рi is the unit sale price of the resource (or the derived product) within the reference territory or at its borders in the ith year, rubles/unit;
сi is the user’s unit cost of extraction, transportation, processing and sale of the resource (or the product derived) in the ith year, rubles/unit. The indicator is calculated net of any extraction, processing and sale taxes on the resource (or the product derived from it);
Qi is total annual consumption of the resource in the ith year, units/year. The estimate can be calculated for two situations:
1) sustainable economic use, where the equation uses the part of Q which does not exceed the standard level of resource extraction;
2) depletion, where the equation uses the part of Q exceeding the standard level of resource extraction.
The economic use of stocks is calculated as follows:
Vi = (pi – ci) x Qi, Vi, where:
Vi is the change in the value of the stock in the ith year, rubles/year;
рi is the unit sale price of the resource (or the derived product) within the reference territory or at its borders in the ith year, rubles/unit;
сi is the user’s unit cost of extraction, transportation, processing and sale of the resource (or the product derived) in the ith year, rubles/unit. The indicator is calculated net of any extraction, processing and sale taxes on the resource (or the product derived from it);
Q is the total annual change in the stock caused by economic activities in the ith year, units/year. The estimate does not include the part of Q which is in excess of the standard level of resource extraction.
Other changes in the stock are calculated by the following equation:
Vi = (pi – ci) x Qi, where:
Vi is the change in the value of the stock in the ith year, rubles/year;
рi is the unit sale price of the resource (or the derived product) within the reference territory or at its borders in the ith year, rubles/unit;
сi is the user’s unit cost of extraction, transportation, processing and sale of the resource (or the product derived) in the ith year, rubles/unit. The indicator is calculated net of any extraction, processing and sale taxes on the resource (or the product derived from it);
Q is the total annual change in the stock caused by non-economic activities in the ith year, units/year.
B) if the resource unit cost was not known and tax receipts were used as substitutes, the opening and closing stocks were calculated by the capitalization of the income gained from the resource, using the following equation:
Vt = Ni x d, where:
Ni is the tax paid for the use of the resource in the ith year;
d is the discount factor.
The economic use of stocks is calculated for each type of natural resources as follows:
Vi = Ni, where:
Ni is the tax paid for the use of the resource in the ith year;
To derive the current market value of most natural resources (except for farm land) we used data on the respective resource taxes because the existing information systems lack data in monetary terms (see Table 3.1). Historically, the systems of statistical monitoring, departmental and regional data reporting in the Russian Federation have not included any systematic information on return rates from various economic activities related to the use of natural resources. The information held by the Federal Tax Service is factually the only source of monetary data on most groups of natural resources. The exception is information on land resources used for farming, where calculation of market value was based on data in form No.9-APK of the Russian Ministry of Agriculture for annual financial statements of agricultural organizations, “Production and cost of crop products.” Valuation of the stock of natural resources was carried out by discounting 92 of current returns. For that purpose, the first method, based on actual returns on the use of natural resources, was used to derive the value of natural resources excluding farm land for only a number of experimental regions; otherwise, the second method based on taxes was applied.
The results of monetary valuation by Russian constituent entities and their aggregation at the federal level estimated the total value of the nation’s natural resources to be equal to 599.4 billion rubles at the end of 2007 and determined the resource structure (Fig. 3.2). The greatest value is assigned to mineral and energy resources (62.98%); the share of farm land is also substantial (31.74%). Water resources (both surface and ground water) account for 2.34%; the share of other natural resources is even smaller: from 1.7% for timber resources to 0.01% for non-timber forest resources. Estimates of the economic value of natural resources in different regions of the Russian Federation (Fig. 3.3-3.5) are varied.
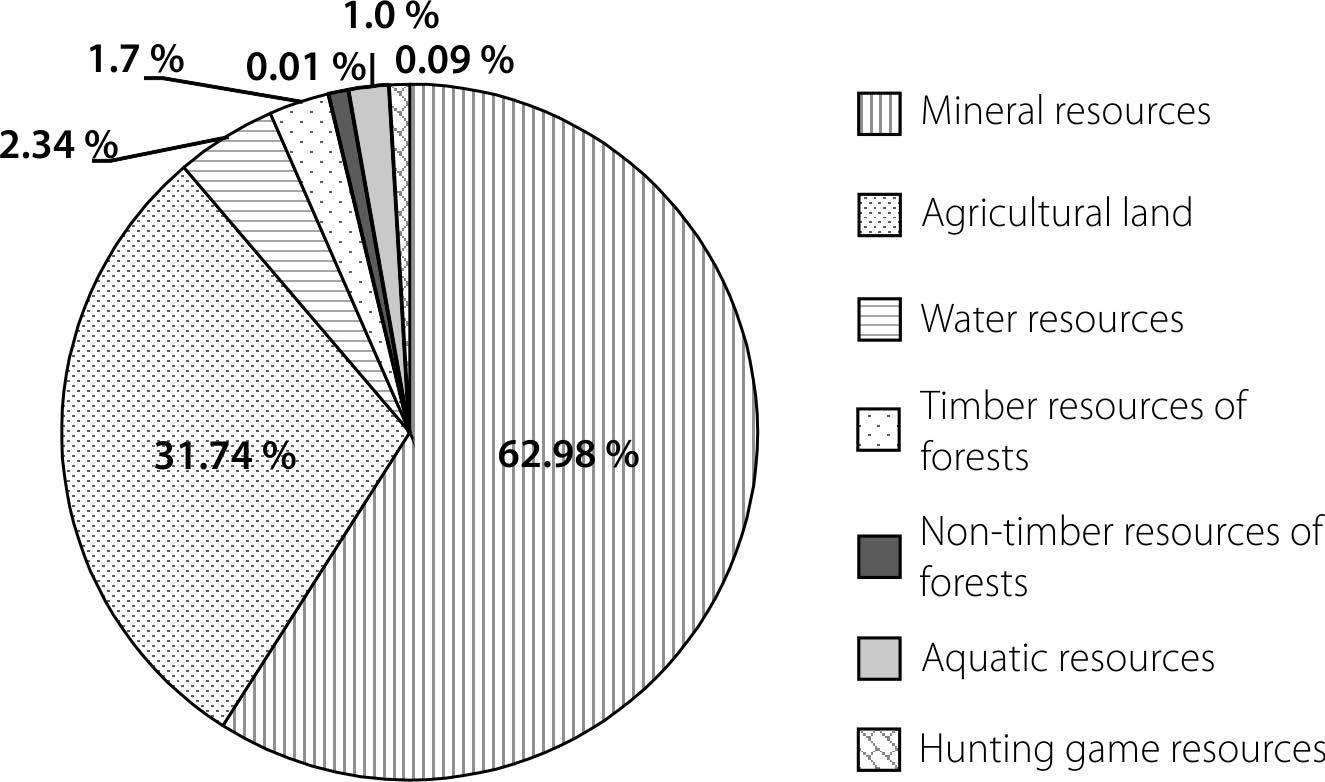
Fig. 3.2 Structure of the natural capital of the Russian Federation at the end of 2007, %
Source: Fomenko G., Romashkina, Gordonov, Fomenko M. & Arabova, 2010.
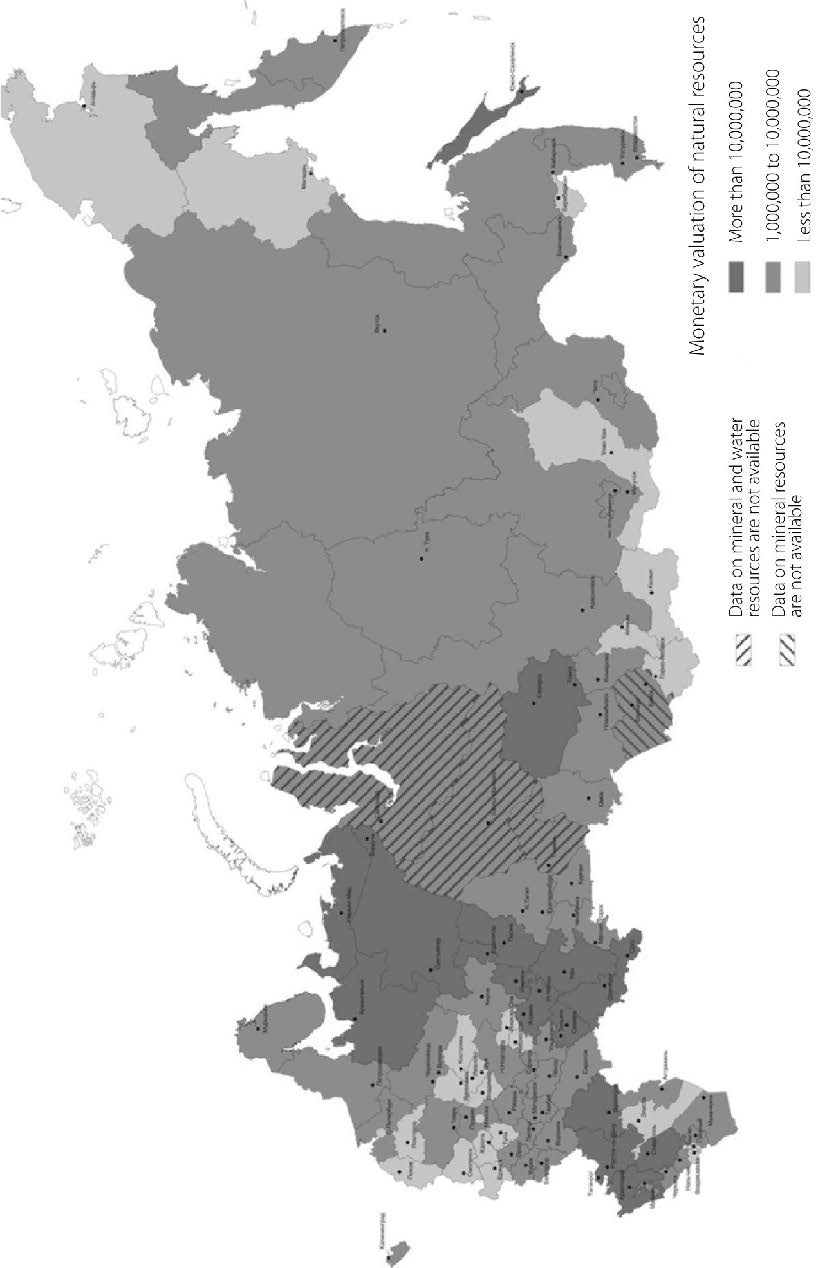
Fig. 3.3 Monetary valuation of natural resources in Russian constituent entities, thousands of rubles, %. Based on information gathered by experts of Rosstat territorial departments in Russian constituent entities at the end of 200 man.
Source: Fomenko G., Romashkina, et al., 2010.
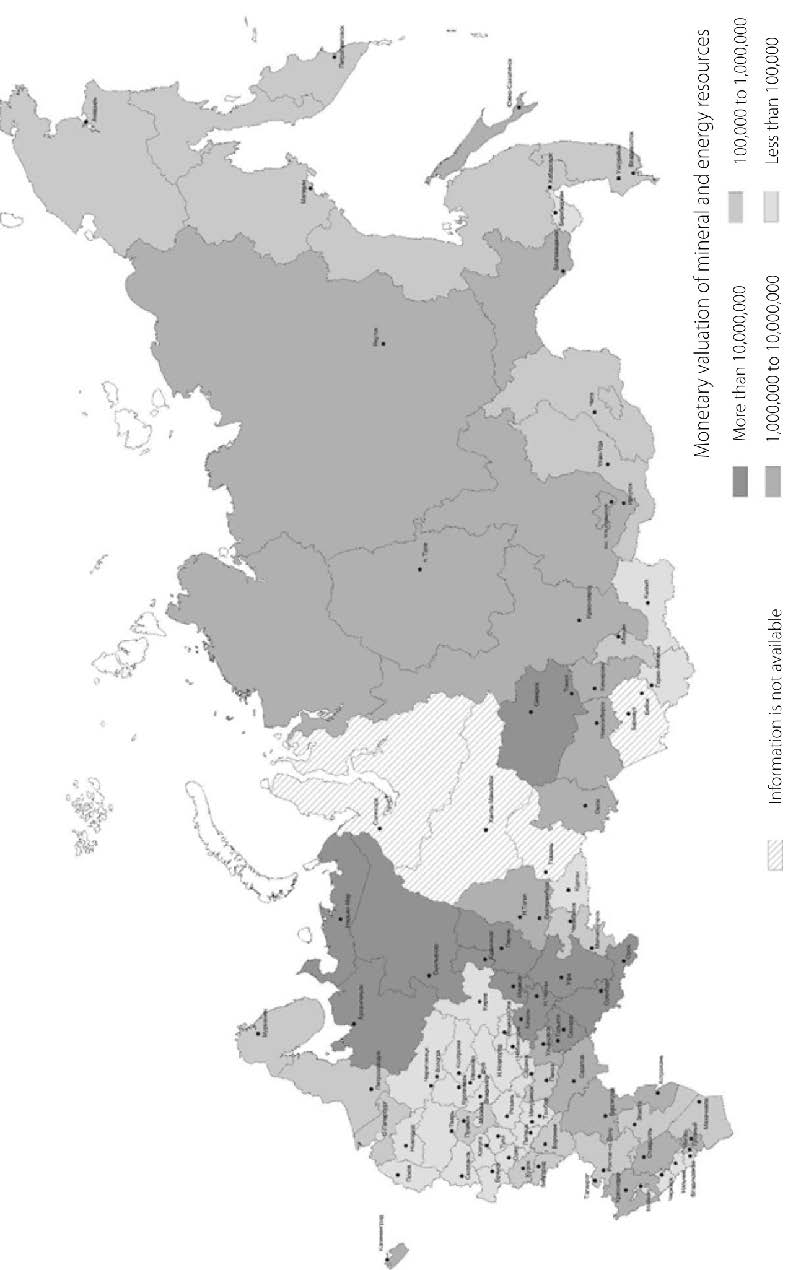
Fig. 3.4 Monetary valuation of mineral and energy resources in Russian constituent entities, thousands of rubles, %. Based on information gathered by experts of Rosstat territorial departments in Russian constituent entities at the end of 2007.
Source: Fomenko G., Romashkina, et al., 2010.
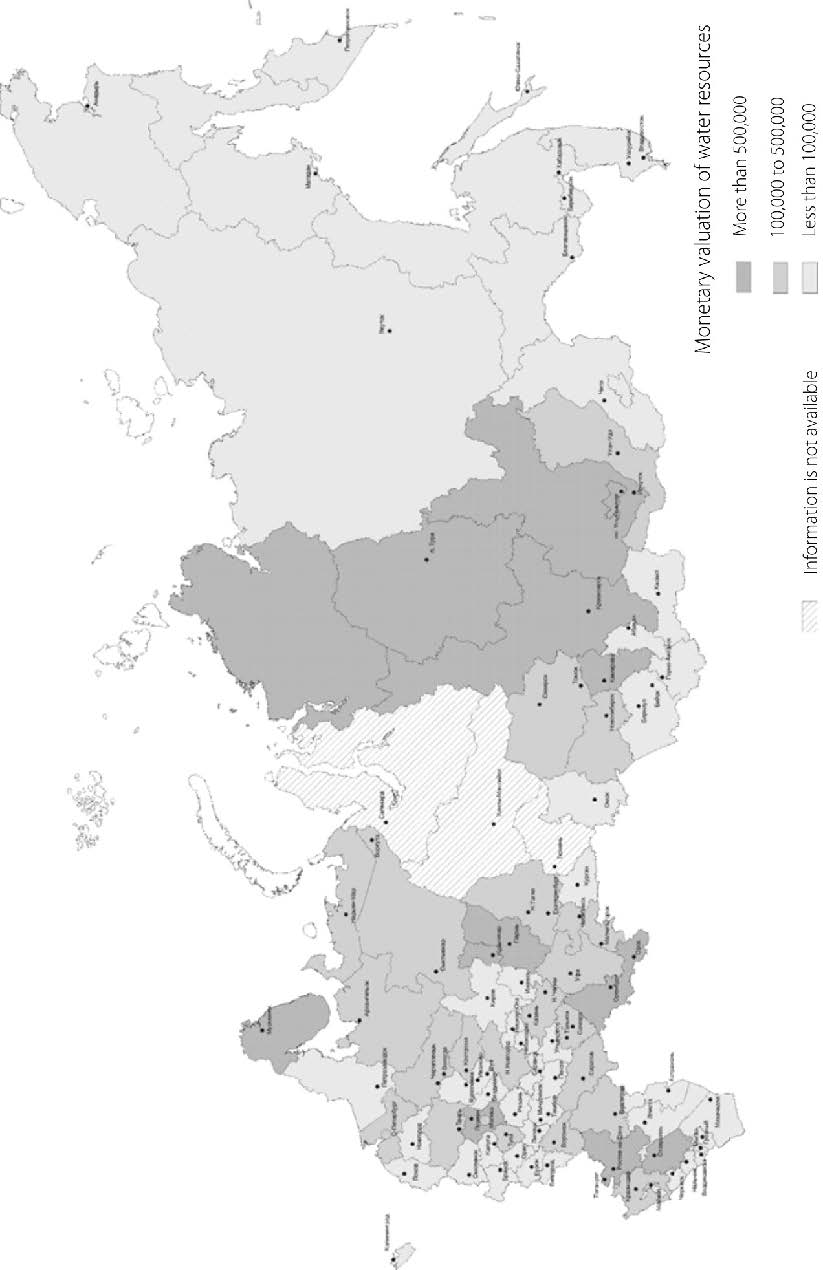
Fig. 3.5 Monetary valuation of water resources in Russian constituent entities, thousands of rubles, %. Based on information gathered by experts of Rosstat territorial departments in Russian constituent entities at the end of 2007.
Source: Fomenko G., Romashkina, et al., 2010.
Detailed pilot studies on the use of SNA/SEEA approaches in some Russian constituent entities (Tomsk, Ryazan, Yaroslavl regions, Republic of Northern Ossetia-Alania) demonstrated that these approaches are feasible at the regional level even with the information resources that are available locally. The monetary estimates of natural resources per unit of the resource (where data are available) exceed monetary estimates derived from data on taxes (Table 3.2). This suggests that valuation of natural resources based on respective taxes leads to material understatement of the monetary value of most categories of natural resources (mineral and energy, timber, aquatic resources).
Table 3.2 Comparison of monetary estimates of natural resources derived from per unit value with monetary estimates derived from taxation data (as exemplified by the study in Tomsk Region at the end of 2007, mln rub.)
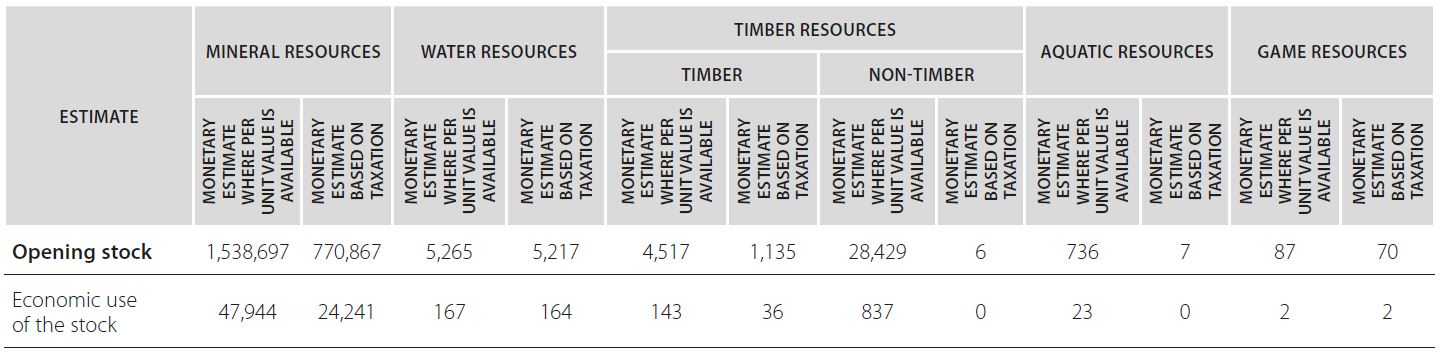
Source: Cadaster Institute, 2008.
So the project gave an assessment of the information base required to evaluate natural resources in the Russian Federation in accordance with SNA/SEEA requirements and determined the main vectors for development of this information base. In particular, it was confirmed that the derivation of adequate estimates of the value of natural resources involves considerable methodological difficulties. The difficulties are primarily due to high volatility of market measures of returns on economic activity (including returns on the use of natural resources, e.g., extraction and processing of natural raw materials) and difficulty in forecasting such returns. The work is held back by the lack of data that are required for the derivation of monetary estimates in existing systems of statistical and administrative accounting. Nevertheless, the Russian statistics are still able to account for the current market value of natural resources using SNA approaches for inclusion in the balance sheet.
The main priority for further development of the monetary valuation of natural resources according to the SNA/SEEA methodology is improvement of the information framework, including collection and generalization of data and streamlining of the relevant information flows. This will expand the government’s capabilities for efficient management of the resource sector, its regulation and forecasting, and for implementation of vital public policies to support Russia’s economic and social development.
Drawing on the research studies, which have been completed, we can spell out some proposals for development of the information base required for valuation of natural resources in the framework of the SNA/SEEA.
1. The available data on physical accounting of natural resources enable environmental-economic accounts (matrices) to be compiled at federal and regional levels, which is of great importance for environmental management and protection. Greater efforts are, however, needed in order to develop the system of federal statistical monitoring with respect to natural assets by including data required for monetary valuation.
2. There is a need to coordinate information flows through interdepartmental cooperation between the Russian Ministry of Natural Resources, Rosstat, Ministry of Agriculture, Ministry of Economic Development and other stakeholders in the process of resource valuation, taking account of their access modes.
3. More attention should be paid to the development of methods of data collection and generalization with respect to mineral and energy resources, water resources and non-cultivated biological resources, which would be suitable for use at the sub-regional level with subsequent aggregation at the federal level.
4. Approaches to recording natural resources in the SNA/SEEA framework need to be improved. In particular, there should be readiness to adapt all updates of the SNA/SEEA methodology to Russian conditions as the updates appear in international documents (UN and others). Special attention should be paid to practical questions, such as whether animals in national parks and hunting farms (“semi-free-range” animals) are to be counted as natural resources.
5. Regular training workshops should be held for Rosstat personnel, including its territorial branches, and other stakeholders to educate them in SNA/SEEA natural resource accounting methods.
Work on valuation of natural resources for their reflection in statistical monitoring should definitely be continued. Use of the appropriation method, which was applied in our project, should be promoted for purposes of natural resource evaluation. It is important to be able to measure returns on natural resources by the residual value method, dividing economic rent on all assets of enterprises into a share referring to produced assets and a share referring to natural resources.
It is also advisable to consider the evaluation of renewable resources (aquatic resources, fauna biological resources, timber resources and groundwater resources) by capitalization of future rent returns (annual return, either taken to be a constant value or assuming its future change). If the stock of those renewable resources is amenable to accounting, one can estimate their value by calculating the net value of the resource (value minus costs), i.e., net returns from simultaneous extraction of the whole stock on the assumption that depreciation of future returns is offset by capacity of the resources for self-reproduction. The value of non-renewable resources whose stock is limited (mineral wealth), should be estimated based on the selling price, the total recorded stock whose development is technically feasible and economically reasonable, and cost-benefit analysis by deriving the net present value of the asset based on the sum of discounted resource rent for the future period of consumption (exploitation) of the stock. The value of land should be estimated by a combination of different methods: capitalization of future rent income, accounting for the market prices of land plots, expert opinion and standards, and the results of land cadaster valuation.
Estimation of the current market value of natural resources by SNA/SEEA methodology and measurement of changes to that value are significantly expanding the potential for analyzing information on Russia’s natural resources as a component of its national wealth. Such estimates make it possible to compare the monetary cost of resource depletion over a year or other period (e.g., due to extraction), the opening and closing stock of resources and monetary estimates of the emergence of “new” resources over the same period (due to the discovery of new viable deposits). This will help to analyze the dynamics of resource stocks, available supply of reserves at existing rates of use, and will help in making justified decisions for optimizing the use of those resources and expenditures to replenish their stocks. It is also interesting to examine the impact of the price factor on the value of natural resources and, hence, on value of the country’s national wealth, since this will help to identify territories with socially dangerous depletion of natural resources. Depletion of deposits that were previously intensively exploited may lead to a sharp rise in unemployment, exacerbation of social conflict and the aggravation of environmental problems.
Specially protected areas (SPAs) are of great value; their ontological, ethical, spiritual, scientific, social and economic value reflects different forms of rationality. These different forms of value, rather than being antipodes, are aspects of the unity of human reason. Recognition of the many-sided nature of rationality expands our understanding of efficient ways of managing specially protected areas. The main goal here is to ensure preservation of these areas, to expand the range of their services to different customer groups based on a scientific approach, to promote the commitment of local communities and businesses to their development and to the integration of SPAs in the social and economic development of regions. The success of such efforts depends largely on due attention to local traditions, encouraging those traditions, which promote biodiversity, and hold in check those, which tend to deplete biodiversity and threaten further development of SPAs.
According to available data, protected environmental areas account for about 13.9% of land surface on Earth, 5.9% of territorial seas and 0.5% of multinational seas. Nearly one-sixth of the Earth’s population derives their subsistence from these territories. By expanding their area and providing better financing, particularly through payment for ecosystem services, these territories could be made into a more efficient tool for preserving biological diversity and increasing social and economic services for the benefit of local communities, countries and the world as a whole (TEEB, 2009). This endeavor will help to preserve ecosystems, biological diversity and unique environments in a condition that can meet the needs of present and future generations. This principle was first declared at the UN Conference on the Environment and Development, also known as Earth Summit (Agenda 21, 1992), and was confirmed by the Convention on Biological Diversity. The decades that have passed since that time have not diminished the relevance of these issues. Moreover, the outcome document of the UN Conference on Sustainable Development Rio+20 entitled “The Future We Want” (United Nations, 2012c) stressed the need to include measures for accounting of the social and economic effects and benefits of biodiversity preservation and sustainable use of its components, as well as ecosystems that ensure provision of basic services, in respective programs and strategies at all levels of territorial organization.
For more than 20 years it has been recognized that transition to new principles of biodiversity preservation is one of the main vectors of sustainable development; and it has been accepted that our perceptions of SPAs need to be changed as the theory and methodology of sustainable development evolves94 . The traditional concept of a SPA as a special sector of the biosphere (an ecosystem of different rank), which is fully or partially, permanently or temporarily excluded from economic activities, has been updated and such areas are now considered being the most valuable natural assets that we possess, playing a significant role in sustainable development and being an important component of natural (ecosystem) capital. The Millennium Ecosystem Assessment showed that natural (ecosystem) capital (as an aggregate of ecosystems, biological species and natural resources) is not only the foundation of all economies and societies but also forms the basis of individual well-being and is of vital importance for the survival and prosperity of the whole planet.
The pilot assessments of economic value of environmental resources and ecosystem services provided by Russia’s federal SPAs, which were conducted by our Institute in 2010 and 2015 using SEEA approaches, led to the important conclusion that the economic value of ecosystem services rendered to communities is very substantial. Monetary estimates of ecosystem services and their aggregation at federal level showed that their economic value as of January 1, 2010 was 2,950,095.8 mln. rubles (at a discount rate of 3%) (Cadaster Institute, 2010) and reached 3,470,596.61 mln. rubles as of January 1, 2015, (Cadaster Institute, 2015b); i.e., growth was 18% in current prices.
According to estimates, the largest share of the economic value of SPAs is represented by recreational resources (61%) and carbon sequestration (38%), while the contribution of other environmental resource uses (primarily, biological) is about 1%. It should be noted that estimates of the economic value of natural resources and ecosystem services in federal SPAs in Russia are, in our view, understated since they mainly reflect direct user values; a range of values, such as direct income to people and businesses in adjacent areas from provision of recreational services, timber resource consumption, haymaking, are not included in the estimates. Indirect user values (preservation of water supply intakes, carbon sequestration by swampland, etc.) are greatly undervalued. According to studies of ecosystem services in the Russian Federation, these functions are of great importance (Ecosystem Services in Russia, 2015). Nevertheless, even the results obtained so far show that SPAs account for a significant share (16%) in the total economic value of Russia’s natural capital.
The high importance of SPAs for sustainable development in Russia and its and regions entails a need to adjust the institutional principles of SPA management; i.e., to initiate gradual and weighted transition to an integrated strategy, (Fomenko G. & Fomenko M., 2007) where environmental management is oriented to ecologically safe sustainable development. This will involve the mobilization of dominant socio-cultural ideas and territorial symbols to canvas public support for SPA environmental activities by all stakeholders and to encourage local initiatives (Fomenko G., 2017; Fomenko G., Fomenko M., Mikhailova A. & Mikhailova T., 2010). Such an approach can motivate individuals and their associations to work to preserve SPAs through support for small and medium-sized businesses, creation of new “green” jobs, and the promotion of cultural traditions that maintain and enhance the socio-cultural status of territories.
The feasibility of such approaches has been confirmed by the results of various projects for methodological substantiation and development of strategic planning and administration of SPA activities, promotion of educational tourism, academic research, etc. At the same time, the universal role and critical importance of indicators (and respective systems of indicators) of the economic value of the natural resources and ecosystem services provided by SPAs to different users have been brought into sharp focus. As demonstrated by projects that have been completed, the derivation of primary estimates and their incorporation in the information base of existing SPAs supported by current monitoring, help to increase the efficiency of daily management and strategic planning both for individual SPAs and for the SPA system of the country as a whole.
These positions were applied in developing methodology and implementing management plans for SPAs (Cadaster Institute, 2015a) in the form of strategic planning documents, based on a systemic approach, taking account of the broadly conceived geographical features of specific SPAs. Special attention was paid to coordination of the efforts of SPAs and external stakeholders, including local communities (indigenous peoples), local government bodies and businesses for the purpose of preserving biodiversity and avoiding conflicts in the sphere of land use and environmental management (including efforts to mitigate existing conflicts). Studies of the process of integration of existing SPAs into the social and economic development of regions suggest that special attention should be focused on contradictions and conflicts, which:
1) arise in relations with local communities (including small business owners) or regional and local government as a result of misalignment of the goals of social and economic development of the territory and goals of the SPA (goal conflicts or teleological conflicts);
2) are determined by social and cultural differences;
3) arise due to differences in motivation of the behavior of individuals, local communities and main resource managers (including the managers of Federal State Budgetary Institutions for SPAs implementing the provisions of federal legislative and regulatory documents) (Fomenko G., 2017). Therefore, special attention should be paid to coordination and alignment between different stakeholders when setting priorities and planning management strategies of SPAs (particularly young SPAs).
Pursuant to the above-mentioned provisions, an algorithm has been developed for managing and planning the activities of Federal State Budgetary Institutions for SPAs, based on current standards of the environmental management system (GOST R ISO 14004-98) (Fig. 3.6).
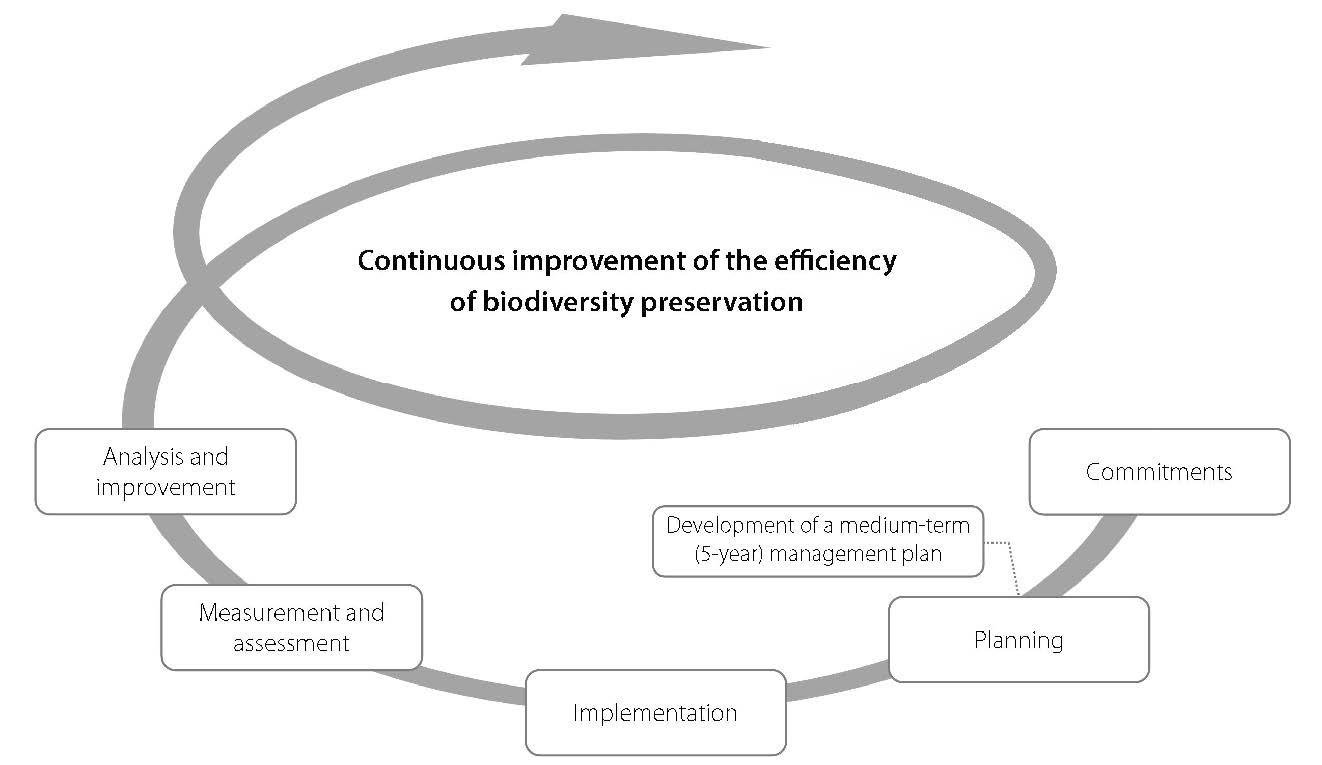
Fig. 3.6 Algorithm for managing and planning activities of Federal State Budgetary Institutions for SPAs %.
Source: Fomenko G., Fomenko M., Loshadkin & Mikhailova, 2002.
This algorithm structures and formalizes the process of managing and planning the work of a Federal State Budgetary Institution for SPA an important segment of the environmental-economic development of a territory It determines procedures and specific actions for improving the efficiency of the Federal State Budgetary Institution for SPA, (maintaining and increasing the value of the SPA in natural capital and preventing its exhaustion for present and future generations). The algorithm includes identification of problems, definition of ways of solving them, development and implementation of relevant managerial actions and assessment of their efficiency.
The environmental-economic substantiation of decision-making in the framework of the algorithm is based on the following premises:
1) each natural object generates flows of environmental resources and ecosystem services, which determine its value, including economic value (i.e., direct, indirect, option value, existence value, etc.);
2) consumption of environmental resources and ecosystem services is to be evaluated in both physical and monetary terms;
3) the consumption of environmental resources and ecosystem services is the basis of the economic value of an SPA and provides resources for its preservation.
This approach helps to identify the most promising vectors for SPA activities, determine efficient mechanisms for preserving unique ecosystems and biodiversity, and establish the most viable sources of additional funding (Table 3.3). Implementation of management procedures in the framework of the algorithm requires data on the economic value of environmental resources and ecosystem services, which the SPA provides, compiled using the methodology of environmental-economic accounting95 . There are special procedures for determining SPA resource stocks and flows of environmental resources and ecosystem services, including parameters of benefit allocation from the SPA and costs of its maintenance. This enables end-to-end monitoring of environmental resources and ecosystem services in the SPA. The findings of such monitoring (in physical and monetary terms) enable assessment of the environmental-economic significance of the SPA for social and economic development of the region and the efficiency SPA management.
Table 3.3 General Algorithm of SPA Management
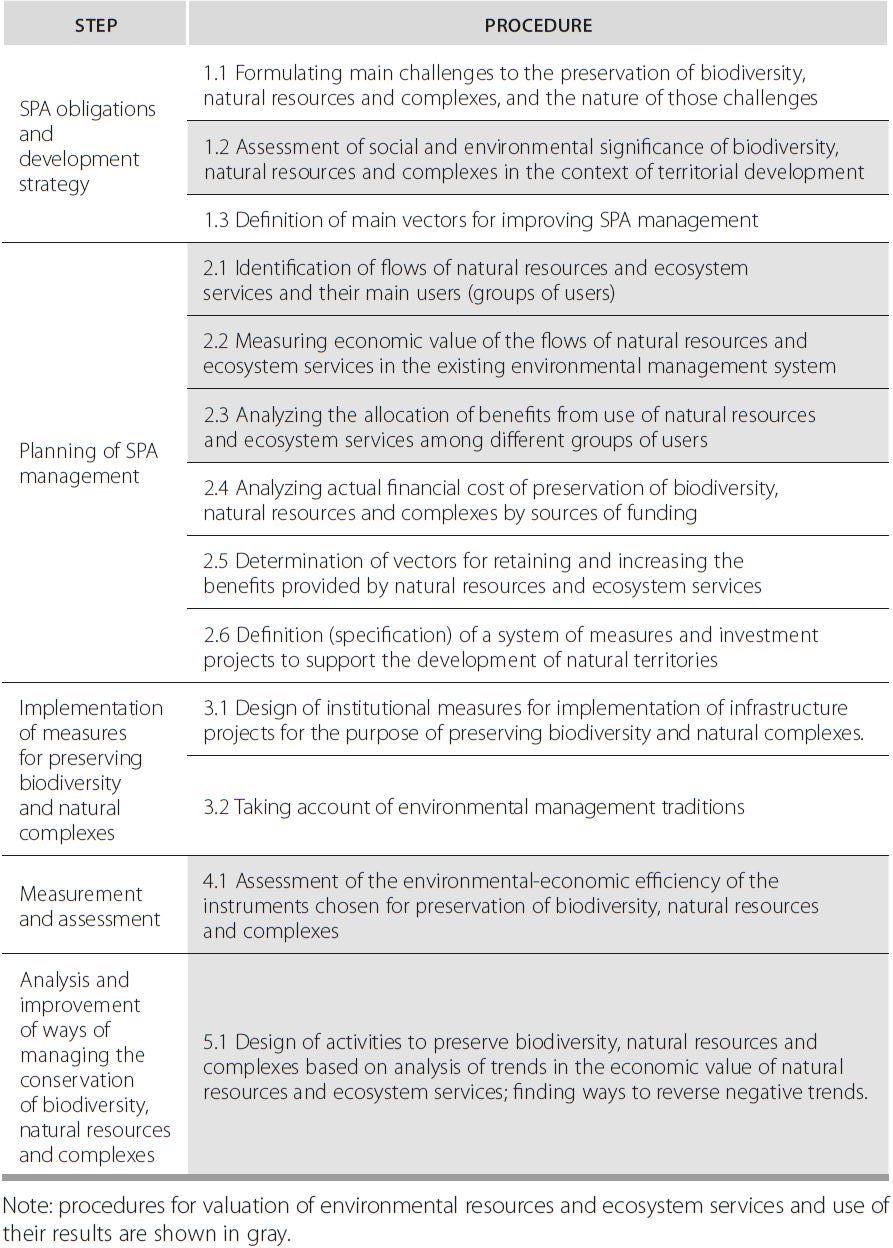
Source: Fomenko G., Fomenko M., Loshadkin & Mikhailova, 2002.
Deriving estimates of environmental resources and ecosystem services in physical and monetary terms depends on the collection and analysis of data concerning the state and main trends in use of SPA resources, natural sites and ecosystem services, and concerning risks of their quantitative and qualitative depletion as well as the causes of such depletion. The analysis also serves to identify and assess economic and other impacts from outside the SPA. The economic evaluation is based on the theory of total economic value as prescribed by the system of national accounts / environmental-economic accounting (UN, 1994a; 2000).
The following estimates are used: market valuation, direct non-market valuation, indirect non-market valuation. Market valuation uses actual market prices of resources, current discounted value of assumed net receipts, and net prices multiplied by the respective quantity of the resource stock. The main emphasis is on the use of real and accessible data on market prices and operating costs.
Direct non-market valuation (subjective valuation) techniques are applied primarily for qualitative (and quantitative) use of the natural environment as a public consumption good. An example may be the value of recreation services provided by the elements of an SPA. The best known valuation methods are based on willingness to pay or to receive compensation; in some cases hedonic value of ownership, wage risk analysis, calculation of travel expenses, etc., are used.
Indirect non-market valuation of environmental resources is based on data concerning actual or hypothetical costs. Factual costs are costs for maintaining the flow of ecosystem services, including biodiversity. Examples are environmental protection costs or expenditures on mitigation of damage (e.g., to human health or materials) caused by degradation of environmental quality. These expenses may be interpreted as the minimum cost of degradation of environmental quality.
Such expansion of the range of tools for economic evaluation of environmental resources and ecosystem services enables previously unobserved facts and phenomena to be used for environmental, social and economic monitoring and SPA analysis, providing quantitative and qualitative data on socio-cultural aspects of SPAs. Detailed cost-benefit analysis of SPAs is performed as part of the SPA management algorithm at the stage of measurement and assessment, using economic estimates (Fig. 3.7).
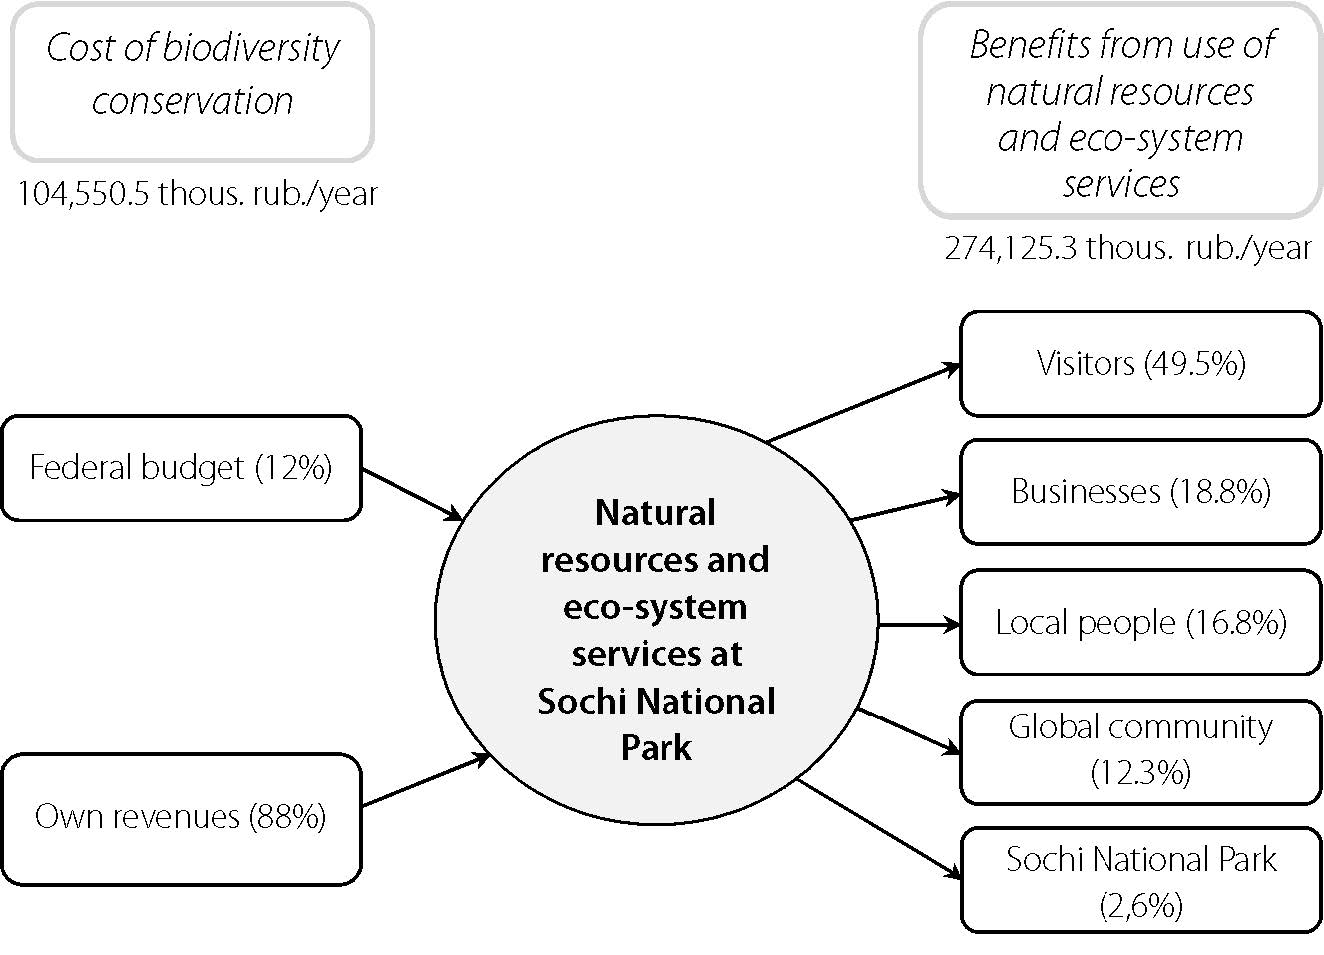
Fig. 3.7 Cost of biodiversity preservation versus benefits obtained by specific receivers of income from consumption of natural resources and ecosystem services in 2006 (as exemplified by Sochi National Park).
Source: Fomenko G., Fomenko M. & Mikhailova, 2006.
As an illustration of the above-mentioned approaches to management of a specific SPA we would cite a project carried out for the Stolby national nature reserve (Cadaster Institute, 2012b). An important feature of the 47,200 hectare reserve is its proximity to the city of Krasnoyarsk, with population of over one million, which ensures a year-round flow of visitors (about 325,000 people per year, according the 2012 data). The vast majority of visitors are residents of the Krasnoyarsk metropolitan area who come to the reserve for a short time (typically one day) for leisure and climbing sport. Protective measures are therefore needed to guard the reserve against excessive human pressure. The most visited part of the park is adjacent to the city boundary where there is a concentration of granite-syenitic rocks, the so-called Pillars (“Stolby”); This tourist sightseeing area of 1300 hectares (2.7% of the whole protected territory) helps to maintain an appropriate operating regime in the rest of the territory of the reserve.
Economic valuation of the environmental resources and ecosystem services provided by the Stolby reserve was made at the initial stage of work on the Reserve Management Plan. The results showed that the largest share of the reserve’s economic value is its existence value (based on hedonic pricing), which accounts for 97.6% of its total economic value, testifying to high social appreciation of the reserve. Recreation services amount to 1.6% of Stolby’s economic value, forest resources are 0.8% (all representing carbon sequestration), water resources are 1.1%, and fishing resources are negligible as a share of total value (less than 0.1%). The main benefits from use of natural resources and ecosystem services at the reserve area accrue to visitors, who are mostly local people and businesses. The estimates, which have been obtained, of the SPA’s ecosystem services highlight the main issues of its upkeep and define the role played by the reserve in the social and economic development of Krasnoyarsk; these points imply the strategic priorities of the Reserve Management Plan.
The expanded perception of the SPA, with estimates of flows of ecosystem services, made it possible to plan activities of the Federal State Budgetary Institutions for SPA that specifically address key needs. As well as data on the SPA’s geographical position, which determine its natural conditions, distance from towns or cities, transport hubs and highways, several other factors were also taken into consideration, such as the number and structure of visitors, the nature of their visits, movement patterns and possible risks (mainly man-made) caused by the presence of people in the territory, including unauthorized visits. The Reserve Management Plan gave particular attention to infrastructure, which could limit the impact of visitor flows on ecosystems and unique natural sites. The main points include:
1) various methods of differentiating visitor flows in order to limit the number of people who penetrate deep inside the territory;
2) building environmentally safe walkways and ladders in places where visitors congregate;
3) arranging garbage removal, water reservoir cleaning and other measures.
In this way the environmental-economic approach based on SEEA methodology becomes an important prerequisite for development and implementation of SPA management plans.
Environmental management of regions based on principles of sustainability is impossible without improved information and analytical support. In our view, a critical role is played by estimates of the state and dynamics of natural capital. Monetary estimates of environmental resources based on the theory of total economic value97 show the linkages between economic and environmental measures. The sum total of such linkages discovered in a specific territory forms a system of integrated environmental-economic accounting. Such a system was initiated in Yaroslavl Region in 1998 (advised by Professor Markandya).98 In the framework of a cooperation agreement between the State Committee for Environmental Protection and Yaroslavl Regional Administration, the first matrices of environmental-economic accounting were compiled and the region’s natural capital, “green” GDP (i.e., GDP adjusted for the use of natural capital) and net gross product were calculated.
The results of the work were approved by the Ecological Council and later by the legislature (Duma) of Yaroslavl region. (Recommendations of the Regional Parliament hearings, “On Sustainable Use of Natural Resources in the Territory of Yaroslavl Region,” July 14, 1998) The importance of adopting a practice of monetary evaluation of natural resources taking account of the ecological factor was stressed in May 1998, when this issue was discussed at a meeting of the Higher Ecological Council of the State Duma of the Russian Federation. In January 1999, hearings were held in the Duma concerning evaluation of natural resources and land relations. These events attracted the interest of Russian regions; studies were subsequently conducted in Tomsk, Ryazan, Kaluga and Leningrad Regions, and in the Republic of Ossetia-Alania (Cadaster Institute, 2006c; 2006d; 2008).
Using the recommendations on environmental-economic accounting (UN, 1993a, 1998), we performed monetary evaluation of different kinds of environmental assets in Yaroslavl Region (ground and surface water, timber and non-timber forest resources, farm land, game animals, sand-and-gravel materials, fishing resources and bee resources) and analyzed the pattern of their changes (as of 1996), Our findings were as follows.
The physical capital of Yaroslavl Region was 143,383 billion rubles at the beginning of 1996 and 142,430.8 billion rubles at the year end. The natural capital of Yaroslavl Region was officially estimated to be 19,777.52 billion rubles at the beginning of 1996, which is only 13.8% of the physical capital value. The low monetary estimate of natural capital points to low efficiency in its use and the need to focus regional strategic plans on industries that process natural resources: added-value wood processing (production of plywood), farm produce processing (particularly cattle breeding), etc. Comparison of the estimates of physical and natural capital of Yaroslavl Region with the respective tax receipts of the regional budget (natural capital accounted for less than 4% of budget revenues in 1996) showed that the structure of tax payments is biased in favor of labor taxation (even taking the insufficient use of natural capital into account). Putting this in perspective, it can be mentioned that the share of taxes and duties on natural resources in pre-revolutionary Yaroslavl Province was over 20%99 . The conclusion was that it would be expedient to adjust tax policy towards gradual increase of rent payments and reduction of labor taxation. This approach will stimulate the development of processing industries, create better conditions for investments in industry, improve and cut the costs of tax collection, reduce corruption, and slow down rates of movement of financial capital (by linking it to land), which will enhance ability to withstand financial crises.
In 1996, Yaroslavl Region experienced relative increase in the proportion of its natural capital to its physical capital. By the year end, the share of natural capital had risen to 14%, which can be explained by greater depreciation and losses of physical capital as compared to natural capital. On the whole, physical capital decreased by 952.2 billion rubles (0.7%) over the year, while natural capital increased by 235.98 billion rubles (1.2%). This was the result of two important trends in 1996: first, by the year end the relative value of natural capital grew in the regional economy as a whole; second, the period saw some improvement in the operating conditions of industries oriented to the use of the region’s own resources as opposed to industries oriented to imported raw materials. These trends should be taken into consideration in macroeconomic analysis and the development of regional strategic plans. The regional administration could usefully establish permanent monitoring and monetary evaluation of natural capital of the region and, in later periods, also of localities in the region.
Gross domestic product in Yaroslavl Region, including the environmental factor (“green GDP”), grew from 16,578 to 16,609.244 billion rubles, i.e., by 31.244 billion rubles or 0.2% in 1996 (in 1996 prices). Net domestic product in Yaroslavl Region, including the environmental factor (“green GDP”), grew from 12,242.1 to 12,273.344 billion rubles, i.e., by 31.244 billion rubles or 0.3% in the same year (in 1996 prices). The increase was due to the inclusion of non-timber forest assets, bee assets, groundwater assets (at uptake from wells) and game animal assets, which had not been recorded previously. This is indicative of the substantial contribution of these resources to the formation of regional income. At the same time, net domestic product decreased due to accounting of the farm land and sand-and-gravel materials.
Overall, account for the changes in environmental assets in the basic version of the environmental-economic matrix (when estimating macroeconomic indicators of regional development) made it possible to:
- identify the environmental component of domestic product, which helps to coordinate the overall regional development policy towards maximization of the environmentally adjusted estimate (taking account of changes in environmental assets);
- determine the impact of the use of basic environmental resources, environment pollution and environmental protection measures on the mode of use of individual resources (sustainable or non-sustainable) and on the final value of the resource stock, which helps to adjust current environmental policies towards sustainable use of the territory’s natural capital;
- incorporate the preparation of environmental strategies in the general strategy of economic development, thereby specifying the role of environmental assets in the formation and allocation of financial flows in the regional economy and helping to source funds for various environmental management tasks.
- analyze and streamline the movement of “environment – economy – environment” financial flows, and to assess the extent and rates of resource depletion.
The principal vectors for further development of environmental-economic accounting in Yaroslavl Region should include further efforts to incorporate man-made pollution in economic accounting and to investigate the long-term dynamic of natural capital, including forecasts. It is equally important to involve local municipalities in accounting of natural capital.
Clearly, the efforts to account and evaluate natural resources in Yaroslavl Region should be complemented by institutional analysis and research into formation and changes of rent (land rent and various types of resource rent). Such studies were carried out by the Cadaster Institute when examining the possibility of benefits for the social and economic development of Yaroslavl Region from use of mineral and energy resources without detriment to the environment (Fomenko G., Fomenko M. & Loshadkin, 1998). The findings defined the main problems, which need to be addressed:
- growing exports of construction raw materials from the region without increase of earnings for regional and municipal budgets. In 1997 more sand-and-gravel materials were exported than consumed (notably in Rostov municipality). Construction of the Moscow-Kholmogory highway (administered from Vologda), increased the burden borne by Pervomaisky and Danilov municipalities. No exploitation of mineral resources should be allowed here based on purely financial and economic premises, which lead to unreasonably low budget revenues.
- extremely low financial transfers to municipalities and to the region when licenses for subsoil use are issued;
- dramatic decline in extraction of building sand and sand-and-gravel materials in a context of still greater reduction of payments for subsoil use and increased share of unpaid taxes;
- increased uptake of groundwater in a context of poor fiscal performance due to the practice of levying duties for subsoil use based on the cost of making products (not used anywhere else in the world);
- reduction of confirmed reserves of construction raw materials. If the practice of the time were to continue for another five years, around 33% of municipalities would lack confirmed reserves of construction raw materials (Fomenko G., Fomenko M. & Loshadkin, 1998).
Drawing on the findings of the research, it follows that, rather than seeking ways of increasing extraction and exploitation of new deposits, environmental management should impose elementary economic discipline in subsoil use as well as in other spheres, such as the use of water and timber resources, keeping in mind the overarching task of maximizing the economic benefits of environmental management for Yaroslavl Region. This is all the more important because the interests of private capital, oriented to vertical integration and the generation of working capital, will tend to weaken economic ties with municipalities and the region. What is needed is an active, competent and tough economic policy on the part of the regional administration for balanced development of municipal economies.
Measurements of the region’s natural capital in 2008 produced a figure of 7.2 billion rubles.100 The calculations were made at the request of the Russian Ministry of Natural Resources and supported by Rosstat (Cadaster Institute, 2007-2009; Fomenko G., Romashkina, et al., 2010). According to international practice, data on the value and structure of natural capital should be updated every five years. At the time of measurement, the bulk of economic value was ascribed to water resources, farm land and forest, followed by mineral and energy resources and game animals (Fig.3.8). The following decade brought substantial changes in the structure of the natural capital of Yaroslavl Region (Fig. 3.8). The share of water resources more than halved, while the share of farm land and mineral resources increased, which is a sign of economic recovery in the region.
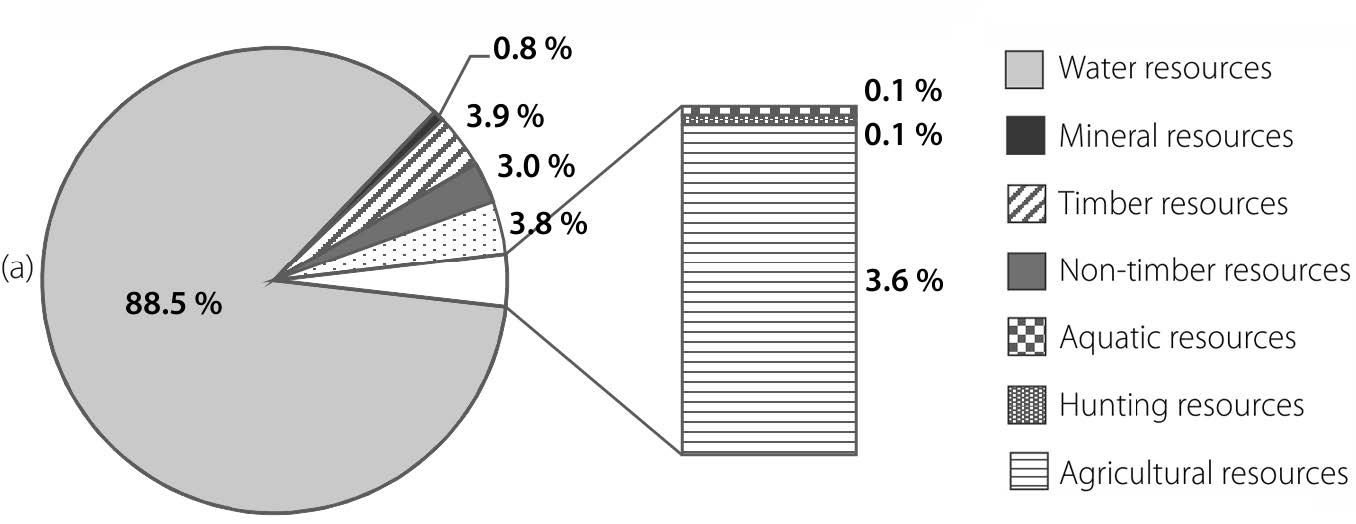
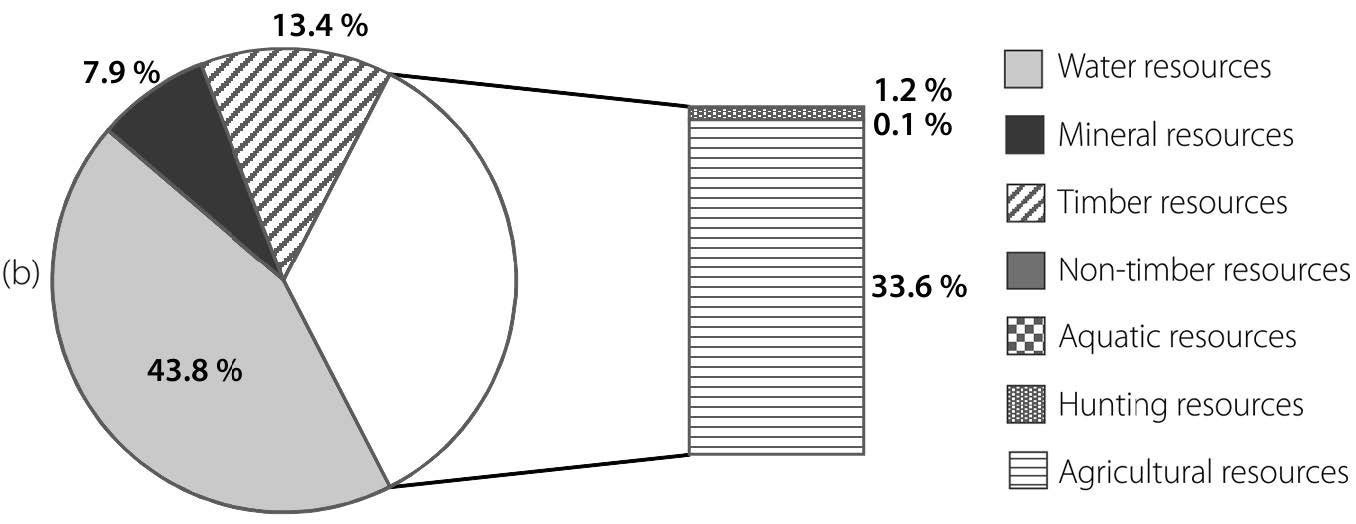
Fig. 3.8 Structure of the natural capital of Yaroslavl Region in 1996 (a) and 2007 (b). %.
Compared with the neighboring Upper Volga regions, Yaroslavl Region is characterized by the lowest economic value of natural capital, based on its current forms of use. However, the structure of natural capital in the five neighboring constituent entities of the Russian Federation is very similar; the greatest value attaches to water resources and farm land (Fig. 3.9).
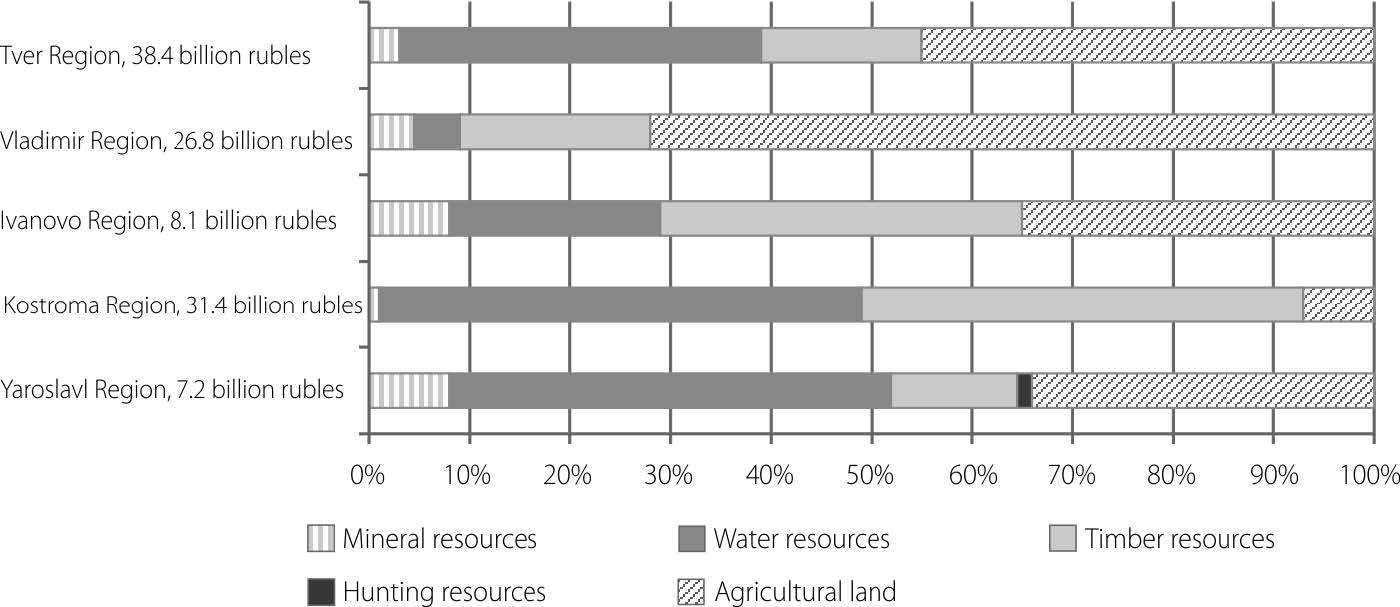
Fig. 3.9 Structure of natural capital of the five regions bordering on Yaroslavl Region as of 2007. %.
Source: Environmental Department & Cadaster Institute, 2013.
Estimate of the value of natural capital of Yaroslavl Region and its changes over 10 years enables a number of conclusions.
First, assuming multipurpose use of natural resources, their comparative concrete economic evaluation (based on SEEA approaches), conducted as a key element of socio-economic monitoring, helps to determine the efficiency of environmental management and choose the most sustainable alternative for use of the natural resource potential of the region as a whole (from the viewpoint of sustainability).
Secondly, the period 1996-2007 saw a steady decline in the value of water resources. This was caused both by shrinking industrial consumption of water in the region and by the fact that there was no indexation of charges for water use (Environmental Department & Cadaster Institute, 2013). It is clear that the allocation of environmental taxes between budgets of different levels and by type of resource is not economically justified. Also, charges for using certain resources are not established at all (or are too low) and lack any incentive power (e.g., for the use of vegetal raw materials, etc.). The use of broader approaches based on the analysis of natural capital (estimated in the SEEA framework) to set tariffs and strengthen the economic principles of taxation would make the system of taxation more efficient. Reforms in the environmental tax system need to happen in two ways: some taxes should encourage people to preserve and support the natural resources they use; others should ensure access for underprivileged people to a limited scope of resources for free or at low prices with a simultaneous increase of the tax rate for the rest of the population.
Thirdly, the structure of industry in Yaroslavl Region in the periods under consideration was insufficiently oriented towards sustainable use of natural resource potential, as implicitly confirmed by the understated monetary estimates of key environmental resources. In this situation, it would be expedient to adjust the environmental management strategy to stimulate transition to the new economy and respective restructuring and retooling of industry and agricultural production to enable greater reliance on the Region’s own resource potential, as well as transition from “linear” to “cyclical” patterns of consumption of raw materials.
So the use of value estimates of natural capital at federal and regional levels provides a set of new data for improving the quality of strategic territorial management and planning. The use of monetary estimates of environmental resources and ecosystem services in accordance with SNA/SEEA approaches enables an effective solution of a whole range of vital problems, including:
1) integration of environmental issues in the general strategy of economic and social development by determining the role of natural resource assets in the formation and allocation of financial flows in the region;
2) regulation of current environmental policy to meet the targets of sustainable development by estimating the effect of actual consumption of natural resources and environmental activities (including pollution) on the mode of use of individual resources (sustainable or non-sustainable) and on the ultimate value of their stocks;
3) improving the budget efficiency of environmental management by optimizing investment and tax policies;
4) improving the quality of strategic ecological assessment of documents related to territorial development and measuring the effect of projects for developing production in the territory, based on economically justified data. Analysis of the geo-economical space in environmental management (applying monetary estimates of environmental resources and ecosystem services) should become an important tool of resource use and environmental protection.
Evaluation of natural capital in accordance with SNA/SEEA approaches, including monetary estimates of natural resources and ecosystem services, provides an efficient economic grounding for a system of measures to prevent and resolve environmental conflicts between a city and its adjoining territory. In 1999-2000, such studies were conducted in the Ob-Tom interfluve area in Tomsk Region with support from the Russian Ministry of Natural Resources and pursuant to the partnership agreement on monetary evaluation of natural resources between the Administration of Tomsk Region, the State Committee for Environmental Protection of Tomsk Region, the Committee for Natural Resources of Tomsk Region and the Cadaster Institute (Yaroslavl). In the course of the project implementation:
— studies were carried out of the condition, extraction, accounting and taxation of main natural resources (water, forest, mineral and energy resources, land, hunting, fishing and recreation resources) of Tomsk Region as a whole and of the Ob-Tom interfluve area in particular;
— based on the completed monetary evaluation of the main natural resources and ecosystem services, a number of proposals were formulated for preservation of the natural capital of the Ob-Tom interfluve area and for improving environmental management efficiency in Tomsk Region;
— professionals in Tomsk Region were provided with theoretical and practical training on use of the SEEA methodology for decision-making to improve regional governance.
The work was performed by experts of the Cadaster Institute and a task team organized by the department for oil and gas and natural resources of the Tomsk Region Administration. Students of Tomsk State University and pupils of Porosino Secondary School (Tomsk District) provided invaluable assistance in the field studies. The project has the political and organizational support of the Tomsk District Administration, the State Committee for Environmental Protection of Tomsk Region, and the Committee for Natural Resources of Tomsk Region (Cadaster Institute, 2000c).
Description of the site and existing issues The territory of the Ob-Tom interfluve area constitutes the natural boundaries of two rivers, the Ob and the Tom (at the place of their confluence), in close vicinity to the Tomsk and Seversk urban areas. The territory extends over 3640 sq.km., or around 1% of the area of Tomsk Region, and its population is almost 3% of the regional total (or about 9% of the rural population of Tomsk Region). There are 76 residential settlements, a number of industrial enterprises and 10 large agricultural businesses, as well as health resorts, summer cottages, garden plots and individual residential houses in the interfluve area. Many of the people living in the interfluve area are employed in Tomsk city.
The Ob-Tom interfluve area is of special significance for the region because it contains an underground water supply intake covering the needs of Tomsk city residents in drinking water. For this reason, nearly the whole interfluve area was declared a water conservation district, though without any compensation benefits for the local residents; as a result, clean water is channeled to Tomsk, while the losses due to sanitary restrictions and a ban on economic activities fall upon people living in the interfluve area.
The problem of efficient management of the relationship between towns and adjoining territories is nothing new. The key issue is conflicts of various intensity, primarily social and economic in nature, caused by ever more acute questions of access to development resources, particularly environmental resources, for different groups of the population. As Russia undergoes a period of reforms, accompanied by property redistribution and changes in the social status of different groups of society, people are increasingly concerned about their future. The creation of new methods for the prevention and resolution of environmental conflicts has therefore acquired top priority in the sphere of environmental management.
Monetary evaluation of the environmental resources and ecosystem services provided by the Ob-Tom interfluve area is of great importance to residents of the area and to the population of Tomsk city because they need to find economic estimates to help resolve a threatened conflict over these resources. Such evaluation will help to improve the economic mechanisms for environmental management in Tomsk Region as a whole.
In the course of the studies monetary estimates were derived for the following kinds of natural resources and ecosystem services provided by Ob-Tom interfluve area, taking separate account of consumption by the Interfluve residents and the population of Tomsk city:
— groundwater consumed through water utilities;
— timber forest resources harvested by logging operators and population;
— non-timber forest resources harvested by households;
— hunting and fishing resources.
The existence value of the Ob-Tom interfluve area as a unique natural site was also estimated as well as value of the area for carbon sequestration by its forests and swamps. The project used UN methodology: direct market valuation based on actual prices, tariffs and fees; direct non-market valuation based on personal perceptions of resource users (e.g., willingness to pay); indirect non-market valuation based on cost data (e.g., caused by damage or compliance with certain standards).
The findings are presented as evaluations of the ecosystem services of the Ob-Tom interfluve area (in physical and monetary terms) broken down into two groups by the main users (Table 3.4).
Table 3.4 Monetary estimates of natural resources and ecosystem services in the Ob-Tom interfluve area
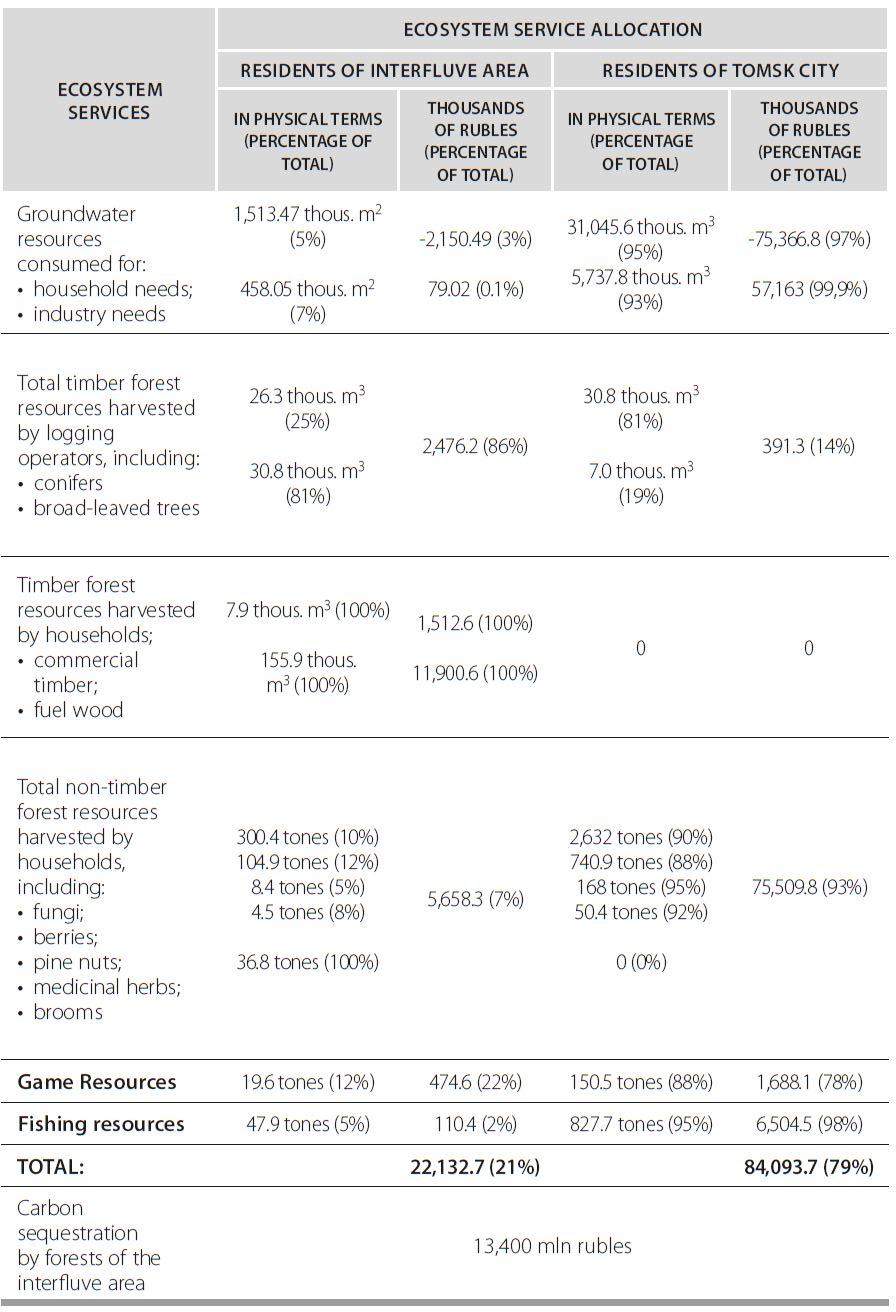
The data presented in Table 3.4 yield the following conclusions:
1. The Ob-Tom interfluve area is rich in natural resources. The most used resources are water (38,754.92 thous. m3/year), timber (308.4 thous. m3/year) and non-timber forest resources (4,046.3 thous. m3/year) Of this amount, residents of the Ob-Tom interfluve area use 5% of water, 71.6% of timber and 11.2% of non-timber forest resources.
2. The total economic value of the main natural resources of the Ob-Tom interfluve area calculated at the social discount rate of 3% (following the UN recommendations), taking into account the function of carbon sequestration, is 446.7 bln. rubles. Without this function, the total economic value of the main natural resources of the Ob-Tom interfluve area is 3,540.9 mln. rubles. The principal component of total economic value is non-timber forest resources (2,705.6 mln. rubles) (76.4% of the total value); timber resources, 542.7 mln. rubles (15.3%); fishing resources, 220.5 mln. (6.2%); game resources, 72.1 mln. rubles (2.1% of the total value).
3. Given the situation of general economic instability and relatively high inflation in Russia, the economic value of the natural resources of the Ob-Tom interfluve area appears to be underestimated. For example, at the discount rate of 28% (the rate of the Russian Central Bank at the time of the evaluation) the total economic value is only 379.4 mln. rubles, which is just 11% of the value calculated at the social discount rate (3%). This fact should be taken into consideration when estimating the efficiency of investment projects. Two alternatives should be considered in evaluating environmental and socially important innovations in the Ob-Tom interfluve area. Preference should be given to results obtained at a discount rate of 3%-7%, which corresponds to international practice (Dixon, Scura, Carpenter & Sherman, 2000; UN, 1994a; 2000; etc.).
4. The Ob-Tom interfluve area renders ecosystem services (without carbon sequestration and existence value) totaling 106.2 mln. rub./year, including services to its own population in the amount of 22.1 mln. rub./year, which is 21% of the total value, and to the residents of Tomsk city in the amount of 84.1 mln. rub./year (79% of the total value of the ecosystem services).
5. Comparing the structure of ecosystem services provided by the Ob-Tom interfluve area to its own residents and to the population of Tomsk (Fig. 3.10), we can easily see that the exports of those services from the Ob-Tom interfluve area to the city are substantially higher than local consumption. This is true except for the direct consumption of timber. Carbon sequestration (despite the absence of relevant measuring technology for separating the flows between Tomsk and the interfluve area) can also be regarded as an important service provided by this area to the population of Tomsk.
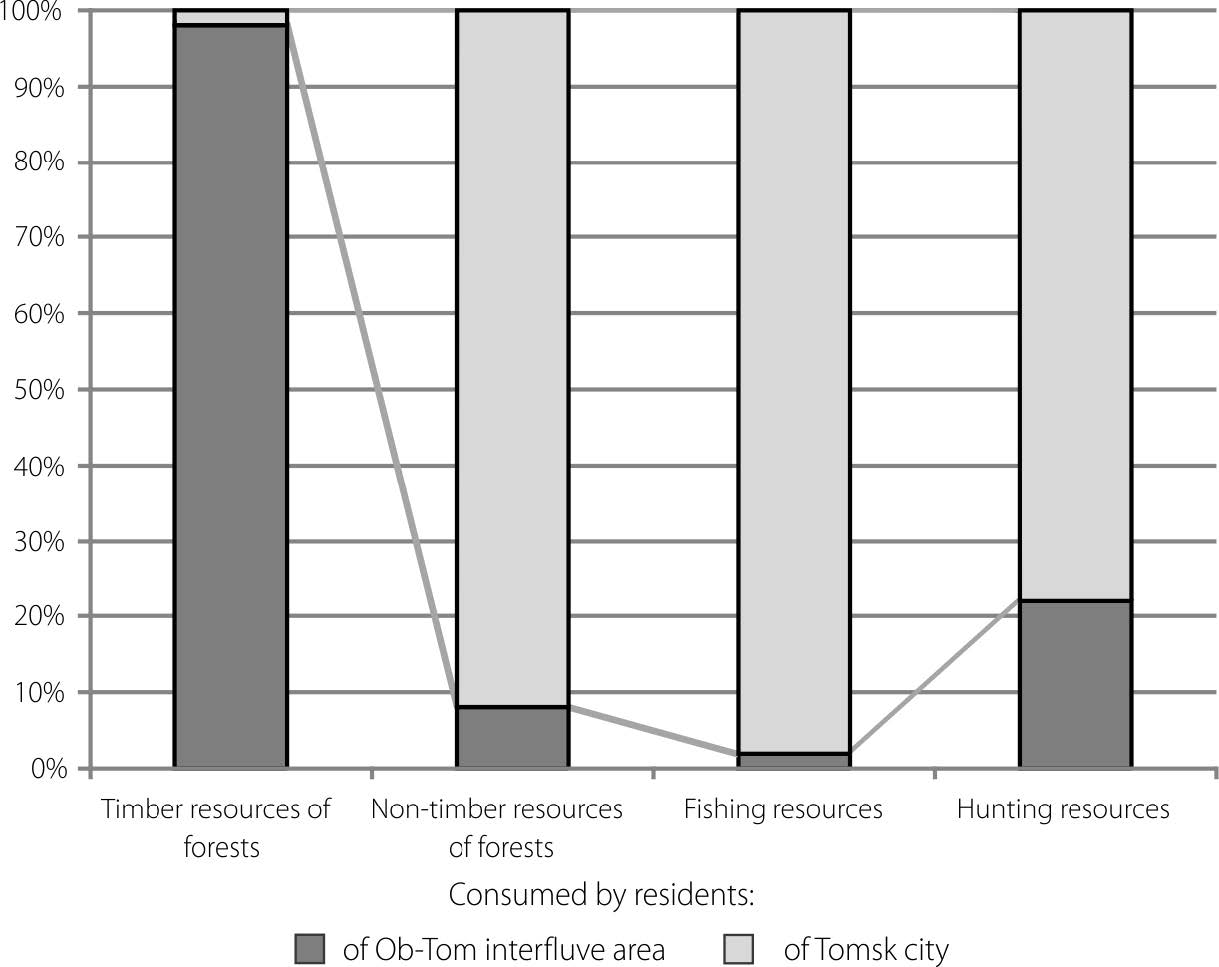
Fig. 3.10 Structure of ecosystem services provided by the Ob-Tom interfluve area %.
Source: Cadaster Institute, 2000c.
The existence value of the Ob-Tom area appears to be highly appreciated by Tomsk residents: a value of 7.4 mln. rub./ year is confirmed by public opinion polls. Consistent with this approach, the Ob-Tom interfluve area is a significant part of the Region’s natural capital and is an important element of sustainable development and quality of life of Tomsk residents.
6. The Ob-Tom interfluve area, as a natural site, should be regarded as a full subject of market relations. Such an approach presupposes the establishment of contractual relations between ecosystem service consumers and providers (represented by the guardians of the interfluve) with payment for the services provided, at a level at least sufficient to preserve them at their current flow rate without decline of total economic value. Taking into account the substantial economic and environmental value of the Ob-Tom interfluve area and high economic value of the services provided thereby, it is recommended (following international practices) to establish the amount of expenditure on restitution of its natural capital (financing various measures to preserve and develop its environmental and social utilities) at a level equal to at least 2% of total economic value of the ecosystem services.
The results of the monetary evaluation suggested some conclusions on the use of the entire set of ecosystem services of the Ob-Tom interfluve area and its individual components.
Water supply via water utilities
1. The economic estimates of water are understated, being below the standard level of developed economies; this is explained by the existing taxation system, which is not oriented to preservation and use of natural resources. It is important to take account of the traditional communal attitude of most local people towards water. Such perceptions of water as a free resource and low income level of the population hinder the implementation of utilities reform.
2. Negative direct estimates of water obtained in the course of economic analysis in Tomsk and in different localities of the Ob-Tom interfluve area with different types of water supply clearly show that water resources are used inefficiently throughout the territory. Direct market value of water in Tomsk is 0.5 rub./m3., while estimates in municipal districts of the Ob-Tom interfluve area range between -0.8 to -2.11 rub./m3.
3. The majority of people living in the Ob-Tom interfluve use a centralized water supply system and a half of them have running water in their homes. Non-centralized water supply predominates in the villages of Kireyevskoye and Pobeda (the bank of the Ob River most distant from the city water supply intake). Most people who have piped water at home are not happy with the quality of the water and reliability of its supply and take their own measures for amelioration.
4. The piped water supply of the Ob-Tom interfluve area is provided by small municipal utilities, which are unable to improve quality due to low revenues from water charges. The opinion poll showed very low willingness to pay for water (1.4 rub./m3). This is despite the fact that people bear high costs to improve the quality of water themselves.
5. Given the current high prices of energy resources and low rates charged for water supply, the municipal utilities are unable to properly maintain the existing piped systems. A new water tariff system needs to be developed. A particularly urgent task is to identify settlements where it is economically viable to support networks in working condition through the coming decade; other communities will inevitably need to revive traditional water sources (wells, boreholes) whose reconstruction and maintenance should be a priority to prepare for possible local water supply crises in coming years. In the present situation, reforms of public utilities cannot be completed in short time frames and will require a differentiated approach, taking account of willingness to pay. Some preliminary data on this issue were obtained in the course of the present research.
6. The intensive use of groundwater from the Ob-Tom interfluve area by Tomsk city is hardly paid for, causing resentment among the interfluve population. Tomsk city residents do not experience any negative consequences from intensive exploitation of the resource, but the local population has a water supply of poor quality. The conflict is largely of a social nature, since there is no direct dependence between the growing intensity of water absorption by the city and water quality deterioration at local level (according to the hydrological surveys, there is no threat of aquifer depletion in the coming 30 years). In view of these points, emphasis in resolving the conflict should be on improvement of the water supply for people in the Ob-Tom interfluve area. As a part of a package of measures, a 1% tax might be added to the existing water supply charges paid by industrial enterprises in Tomsk in order to cover the environmental costs of preserving water resources and forests in this territory. The additional fees should be allocated to the environmental fund of the Ob-Tom interfluve area.
Forest resources Multipurpose forest management
1. The area between the Ob and Tom rivers accounts for half of the timber, harvested in Tomsk District. Most of the harvest consists of conifers. A large part of the timber is sold by tender and taken out of the Region. The total volume of the harvest is substantially smaller than the standard felling rate (there are a lot of over-mature trees). Conifers are cut three times as fast as broad-leaved trees and most of the felling is close to settlements. The forest structure is gradually deteriorating as a result, being dominated by broad-leaved trees of lower value.
2. Low living standards of the population are a major factor for the illegal felling. According to forestry experts, nearly 40% of the Ob-Tom Interfluve forests is cut illegally. In this situation, forest operators are forced to sell timber at less than the cost of production, and official prices today are close to prices on the illegal commercial timber market. The extensive illegal market drives official companies to the verge of bankruptcy. In this situation, following the practice of foreign countries, the fight against illegal felling has to be combined with a differentiated approach to timber pricing. Special privileges should be restricted and strictly targeted. A package of measures is needed to link social safety measures for the rural population with forest protection and use.
3. In general, current direct market prices characterize the timber market quite adequately. However, a certain share of timber is sold below market prices (in quantities stipulated by the government). This represents the minimum rates for standing timber. The municipal authorities in Tomsk District (the rural district around the city of Tomsk, including the interfluve area) are not motivated to create an efficient timber market, since the local budget revenues are based on minimum rates. The difference between the minimum rate for standing timber and tender prices is treated as budget funds and allocated to the forestry enterprises in federal (not local or regional) subordination. In this context it appears to be reasonable to increase the minimum charge by reducing the industry “tax” for issuing felling permits, basing the latter on actual costs. As can be seen from the practices of other Russian regions, the permit payment is, as a rule, excessive and represents a mechanism of reallocation of the stumpage (basically rent) payment from the municipality in favor of the industry.
4. The Ob-Tom interfluve area has inadequate capacities for timber processing. There is only one enterprise in operation, and it processed as little as 3300 m3 of timber in 1999. The enterprise operated erratically due a high level of depreciation of its equipment. There is no value-added wood processing in the area.
5. The monetary estimates in the Ob-Tom interfluve area revealed two trends: on the one hand, the regional forest industry is clearly in a critical state; on the other hand, commercial wood harvesting is not the most profitable form of resource use in this territory and can be supplemented by earnings from other forms of forest use.
6. The monetary evaluation of the Ob-Tom interfluve forests showed that they have considerable economic value apart from their value as timber. Annual income brought by the territory as a source of foodstuffs and valuable raw materials (mushrooms, berries, nuts, medicinal plants, game animals and fish) is substantial. It amounts to 89.95 mln. rub./year measured in 2000 prices. The net value of the wild crop exceeds the profits from exploitation of the forest for its timber.
7. The existence value of the Ob-Tom interfluve area is much higher than direct income from clear-cutting of its forests. In the course of evaluation we considered two components of the existence value (willingness to pay for preservation and maintenance of the territory in monetary terms and in terms of labor costs). The data obtained not only demonstrate the definite stance of the people of Tomsk regarding preservation of this recreation site but also indicate some ways of actually preserving it, as follows:
— introduction of a special-purpose tax to be established on a case-by-case basis (or by introducing a special item in the general structure of utilities bills paid by Tomsk city residents or a fee to be paid for driving into the Ob-Tom interfluve area). The option of a “driving fee” would ensure that the least affluent city residents do not have to pay for use of the Ob-Tom natural resources; a similar mechanism is practiced at the Curonian Spit national park in Kaliningrad Region.
— establishing a special-purpose fund for preservation of the natural capital of the Ob-Tom interfluve area as an independent organization or a subdivision of the regional ecological fund. The supervisory board of the fund should include representatives of the Ob-Tom interfluve area, Tomsk Region and Tomsk city;
— setting up a supervisory committee and making provision for public monitoring of the establishment and use of the fund;
— involvement of city residents, civic organizations and activists in efforts to preserve the Ob-Tom interfluve area.
So sustainable development of the Ob-Tom interfluve area and Tomsk city depends on measures to prevent environmental conflicts. In designing such measures, we should consider the territory’s natural capital as the basis for social and economic development and, at the same time, as an important limiting factor.
Monetary estimates of natural resources were carried out to forecast local exhaustion of mineral deposits and help find ways of preventing a development crisis (local budget losses) in Lisogorsky District, Saratov Region, in 1999-2000. The work was supported by the Russian Ministry of Natural Resources pursuant to a partnership agreement on monetary evaluation of natural resources between the government of Saratov Region, the Committee for Natural Resources of Saratov Region and the Cadaster Institute.103 The SNA/SEEA approaches were used. In the course of the project implementation:
— the study looked at the availability and use of natural resources, ways of exploitation and regeneration of the main mineral resources, and budget efficiency in exploitation of the resource potential of Saratov Region as a whole and Lisogorsky District in particular (focused on raw hydrocarbons, common mineral resources and groundwater);
— proposals were formulated for improving the social and economic efficiency of mineral resource use at minimum environmental damage threat level as part of the development program of Lisogorsky District (using monetary estimates of existing mineral deposits and groundwater) and in the context of efficient development of the mineral wealth of Saratov Region;
— professionals in Saratov Region received theoretical and practical training on use of the SNA/SEEA methodology of environmental-economic accounting.
The work was performed in cooperation with a task team organized by the Committee for Natural Resources of Saratov Region. Invaluable help and assistance was provided by the undergraduate and postgraduate students of Saratov State University who took part in the field studies, as well as the Government of Saratov Region, Administration of Lisogorsky District and Uritsky Okrug.
Description of the site and the existing issues Lisogorsky District is located in the southern part of Saratov Region on the right bank of the Volga river. The district extends over 2300 km2 and includes 15 municipalities and 47 residential settlements. The center of the district is the town of Lisiye Gory, situated 96 km away from Saratov and having a population of 21,900 people.
Lisogorsky District is a net receiver of budget subsidies. A large part of local budget revenues is provided by charges for the use of natural resources: they account for 28% of budget revenues. The greatest part (90% of receipts) is from charges for subsoil use (extracting oil and gas). The remainder comes from use of groundwater. So the sustainability of tax revenues from the mineral resource sector is a vital aspect of the development of Lisogorsky District. The issue of tax sustainability is directly linked to the depletion of exploited deposits and their replacement by new discoveries.
The natural resource sector has traditionally been defined as the “growth engine” of the local economy. Under competent guidance, mineral resources could promote economic stability and sustainable development to a much greater extent than is the case at present. As the use of local mineral resources expands and the resource sector of the economy develops, investment appeal of the territory grows and its tax base increases, which boosts economic growth and stability.
Monetary evaluation of the mineral resources of Lisogorsky District was motivated by the urgent need to find and develop ways of maximizing territorial benefits from the exploitation of local mineral resources and defining appropriate measures at the regional level. The studies covered the following monetary estimates: reserves at the Uritsky oil and gas deposit, the Butirsky brick clay deposit and Vorobievsky building sand deposit; groundwater consumed by the water supply utilities of Lisiye Gory municipality and Uritskoye township.
Depletion was estimated using the following calculation methods: user cost; net price; current value. Water estimates were derived using methods of direct market valuation (by user accounts and prime cost of water in water supply utilities); direct non-market valuation (by willingness to pay for the services of water supply utilities); and indirect non-market valuation (spending by households to improve quality of the piped water they receive).
The results obtained yield the following conclusions.
1. The valuation of reserves at the Uritsky oil and gas deposit used intra-corporate oil prices of oil extractors in Saratov Region. The valuation showed that at the current rate of exploitation of the deposit, remaining reserves of oil and gas in physical terms will be depleted by 2024-2025 (Fig. 3.11) However, the economic resource life is half that of the physical life. Besides, when the oil is sold at intra-corporate prices, associated gas extraction, being loss-making for the subsoil user, halves the oil rent and the cost-effective production life of the resources (Fig. 3.12).
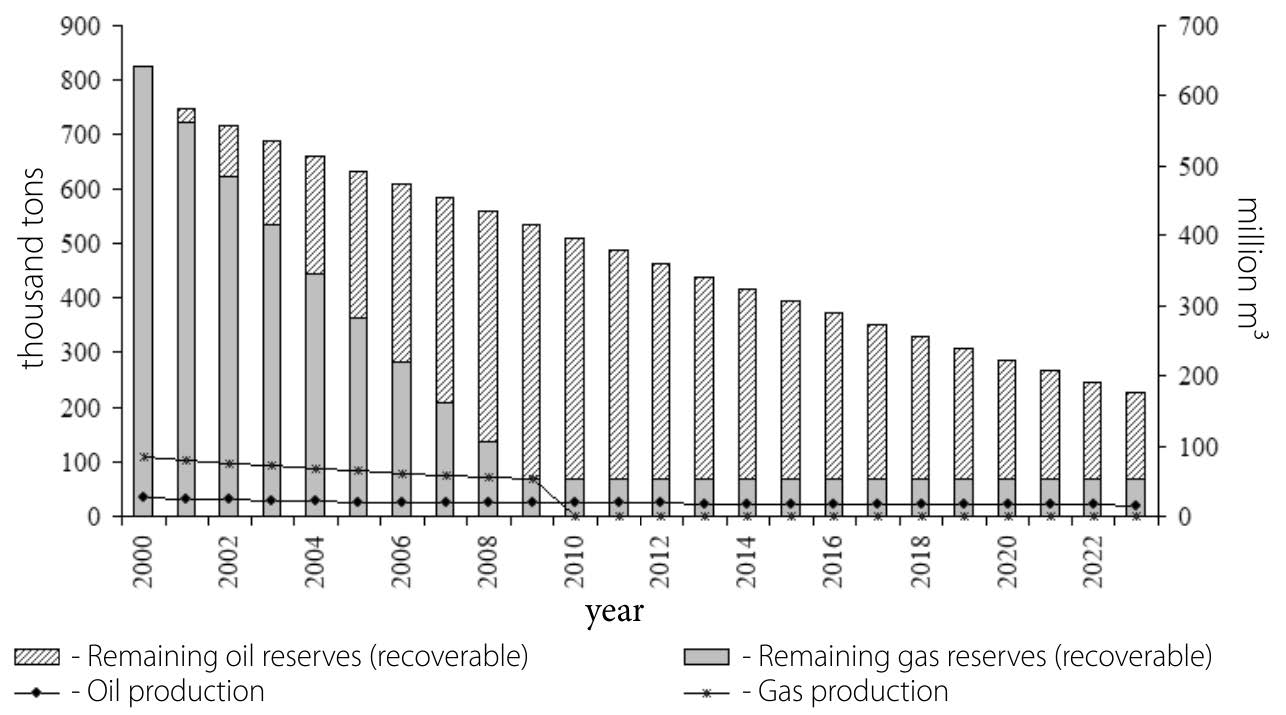
Fig. 3.11 Projected extraction dynamics at the Uritsky oil and gas deposit %.
Source: Cadaster Institute, 2000e.
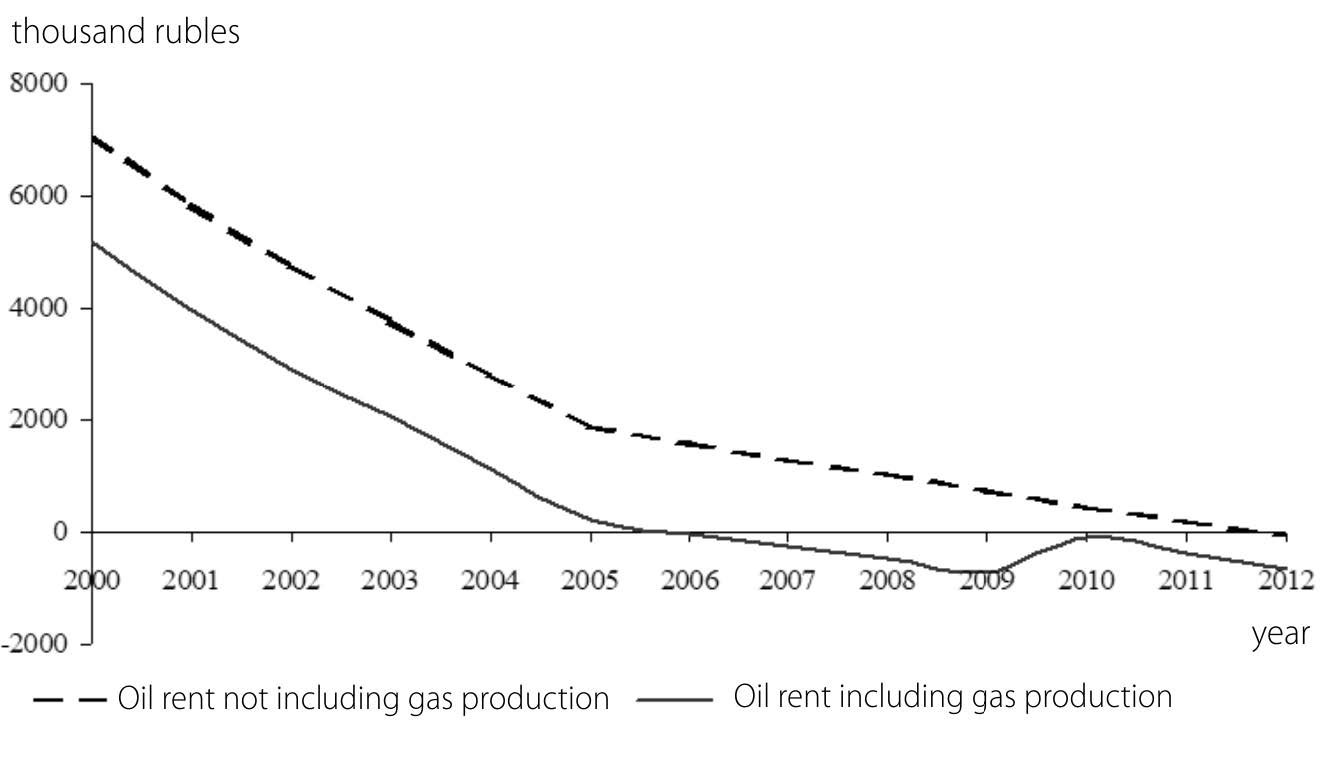
Fig. 3.12 Dynamics of rent flows at the Uritsky oil and gas deposit (intra-corporate prices in 2000) %.
Source: Cadaster Institute, 2000e.
It was found that, at the current rate of exploitation, unless some special economic policy was introduced, the budget of Lisogorsky District would lose 30% of its revenues five years from now. Lisogorsky District is unable to ensure sufficient investments in the real sector to maintain stable consumption after reserves at the deposit are depleted. In order to provide the required revenues to the district budget after depletion of the Uritsky deposit special efforts will be necessary to raise external funds for investing in oil and gas exploitation at prospective areas in the District.
2. Estimates of rent on production of brick clays and building sand, described above, were negative. This means that their development currently fails to provide subsoil users with returns that at least match the average regional rate of return on similar deposits. As a result, both the resource owner (the state) and the users of the resources (enterprises) incur losses: the former does not receive the respective tax returns, and the latter bears losses due to inefficient use of their own capital. Development of the Butirsky and Vorobievsky brick clay and sand deposits is of social rather than economic significance for Lisogorsky District: these assets provide jobs and play a role in forming product flows within the district.
3. Main vectors for development of the mineral resource complex of Lisogorsky District were defined on the basis of the monetary estimates obtained:
— stabilization of oil and gas extraction by prompt exploitation on a competitive basis of “mothballed” deposits;
— ensuring growth of commercial reserves by boosting oil and gas prospecting at promising sites;
— development of the local construction industry by exploiting known deposits of construction materials;
— raising investments and creating new product and financial flows by organizing the use of mineral pigment reserves (abundant in Lisogorsky District) and establishing an integrated production facility for extraction of chalk stone and subsequent production and sale of its products (fine-dispersed chalk, lime and carbides);
— cutting the costs of agricultural production and making it more environmentally friendly by the use of local mineral deposits that can be used for fertilizer production.
4. Studies of public water supply and monetary estimates of water showed that households, industrial and agricultural businesses in Lisogorsky District are securely provided with groundwater resources at present and in the long-term. However, the existing water supply system has a number of major shortcomings, which local people resent. Solving the existing problems will require serious repair work, restoration and construction of wells and water mains, and work on water purification and treatment. Meanwhile, the public water supply systems are making losses, respective establishments and organizations continually lack funds, and most of them rely on subsidies from the local budget and other sources.
Monetary estimates of water consumed via water utilities are presented in Table 3.5.
Table 3.5 Monetary estimates of water consumed via water utilities
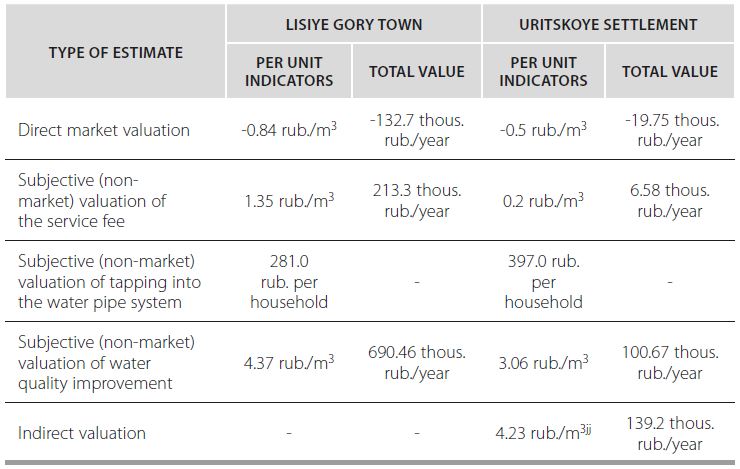
Source: Cadaster Institute, 2000e.
Table 3.5 shows that the existing practice of charging fees for water supply is economically unjustified: valuations of water by the people of the town of Lisiye Gory and Uritskoye settlement, based on willingness to pay, are much higher than the negative estimates of the direct value of water (based on the existing service charge). This is evidenced by the data in Fig. 3.13 and 3.14.
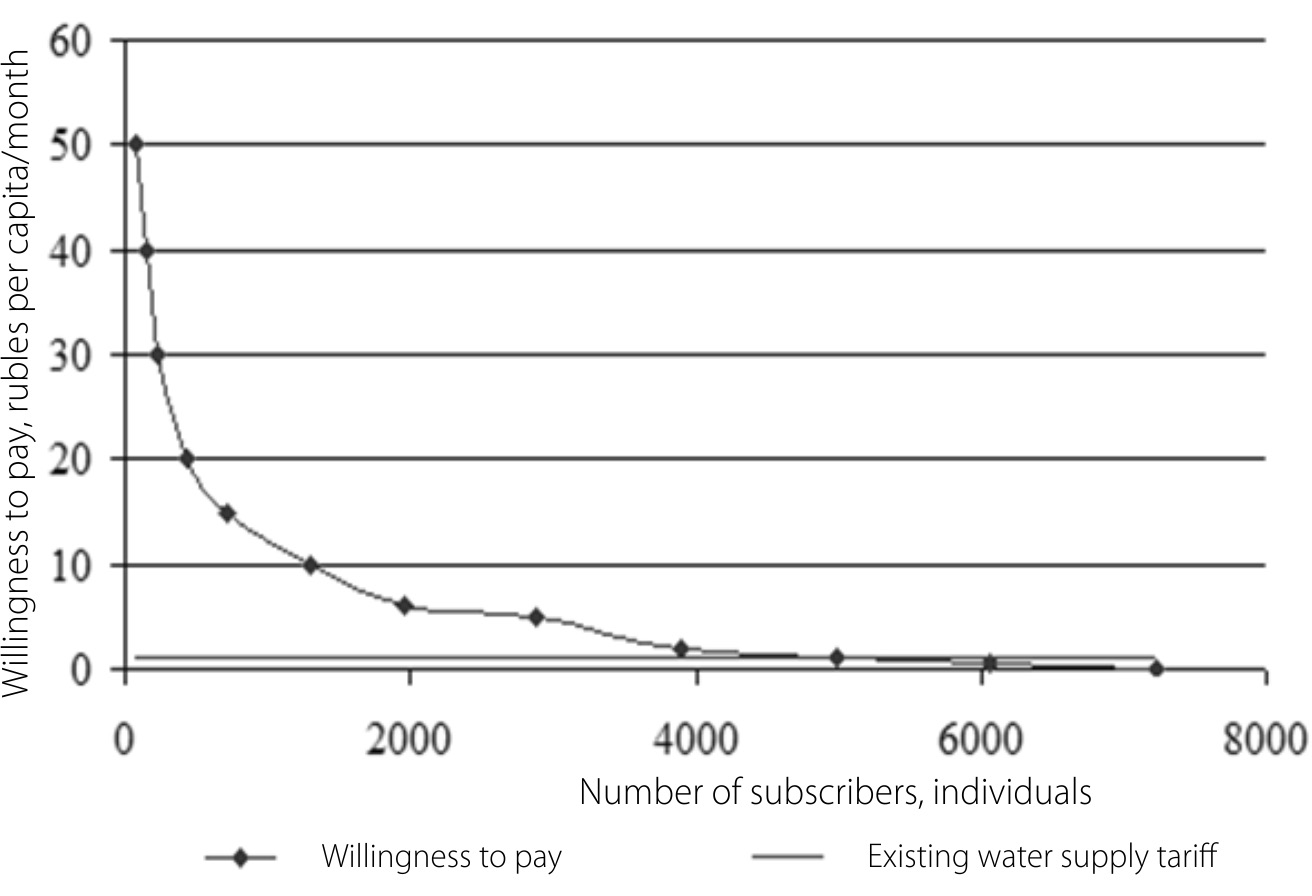
Fig. 3.13 Willingness to pay for piped water (town of Lisiye Gory) %.
Source: Cadaster Institute, 2000e.
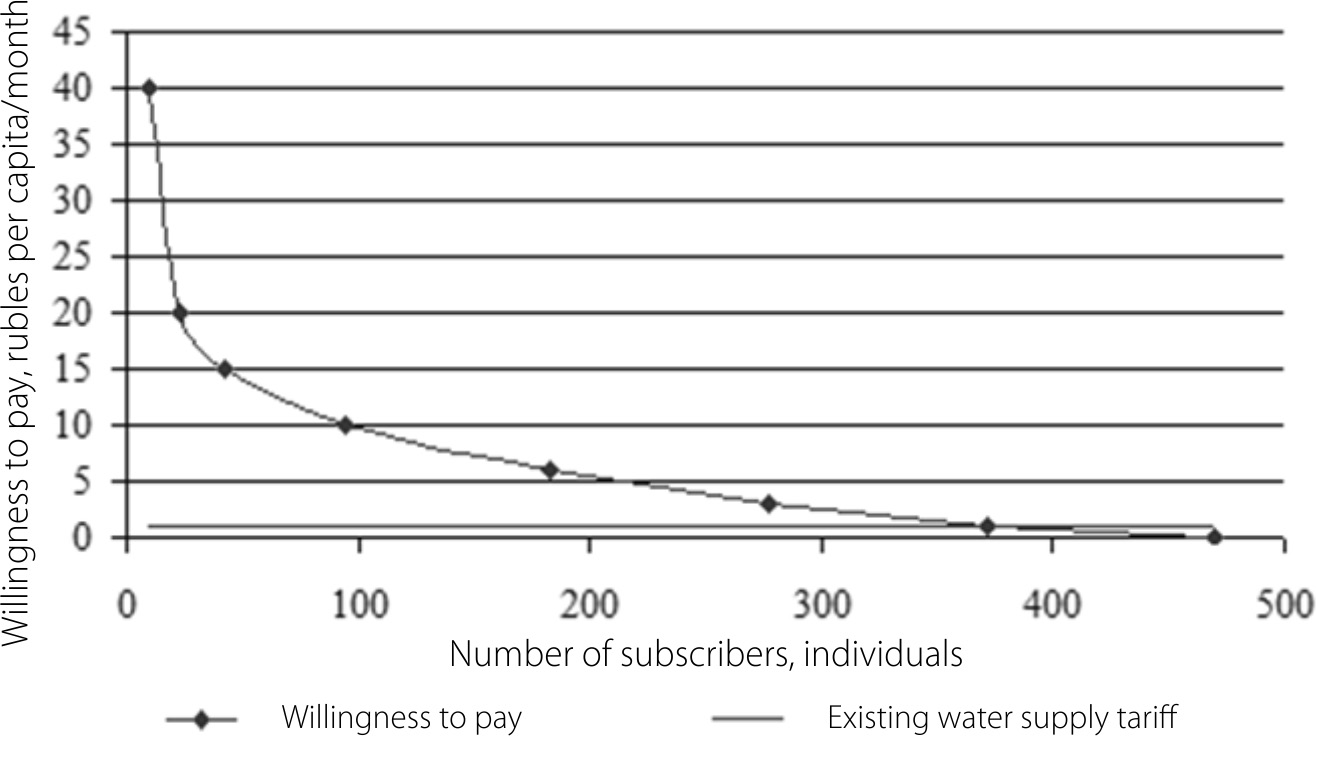
Fig. 3.14 Willingness to pay for piped water (Uritskoye settlement) %.
Source: Cadaster Institute, 2000e.
In addition, people have considerable effective demand for connection to the piped water system and improvement of their water supply quality (Fig. 3.15 and 3.16)
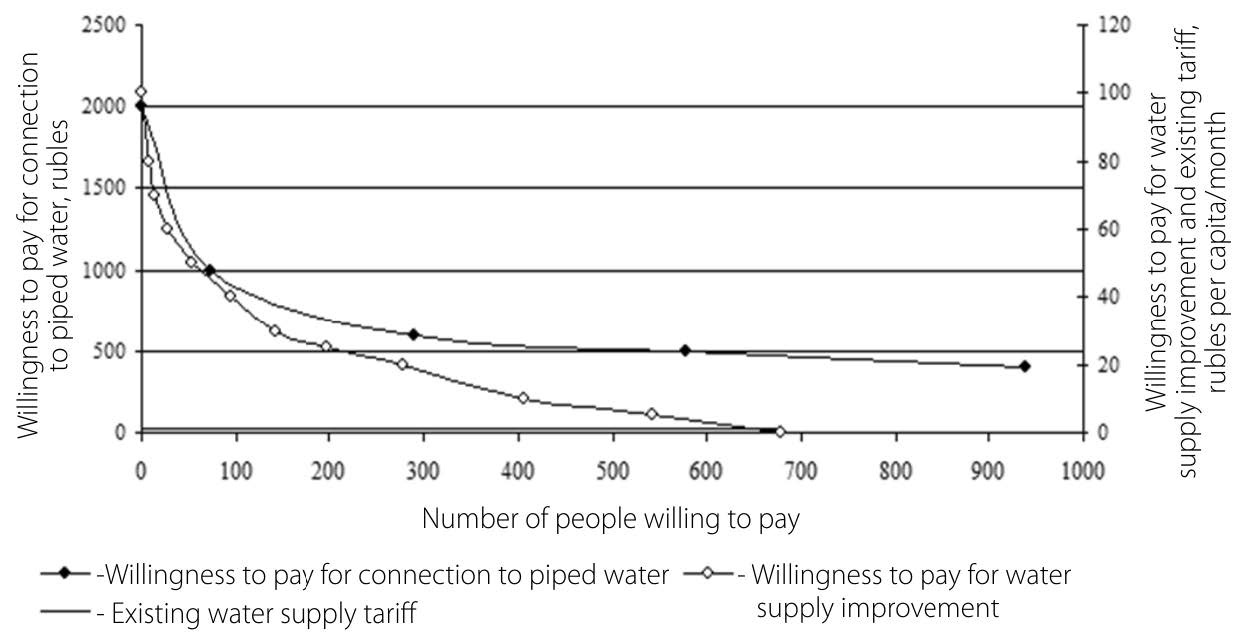
Fig. 3.15 Willingness to pay for connection to the piped water system and water supply quality improvement (town of Lisiye Gory) %.
Source: Cadaster Institute, 2000e.
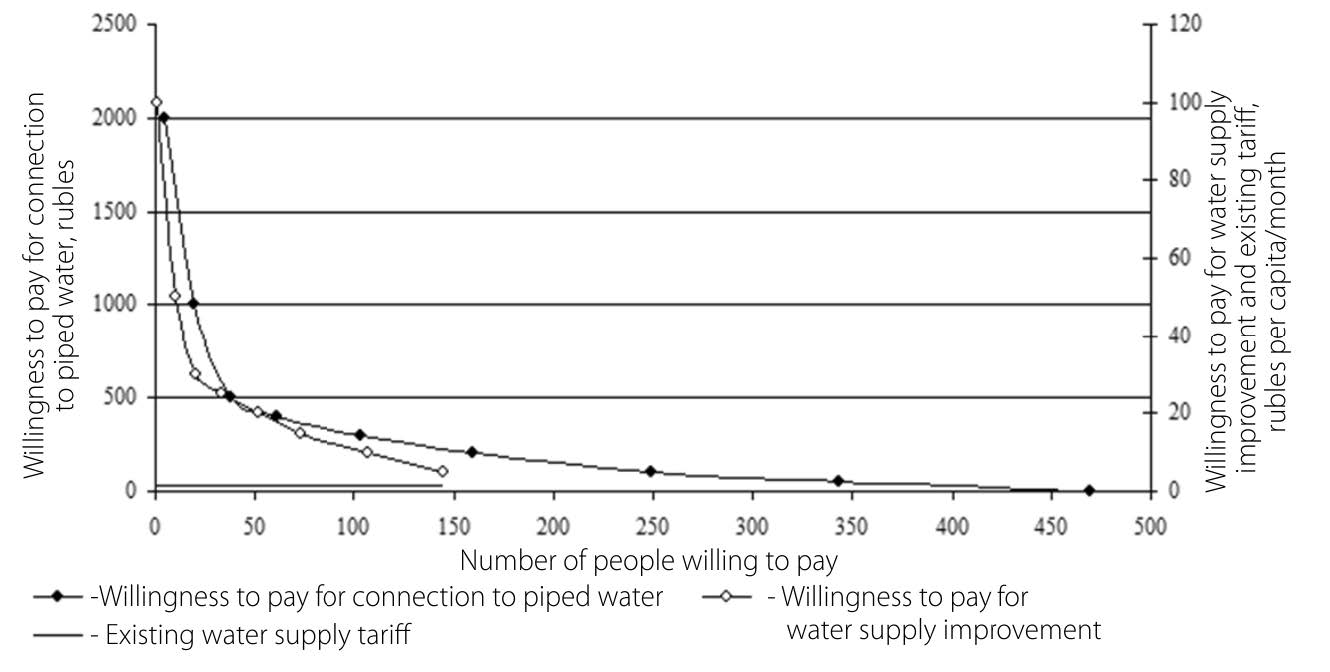
Fig. 3.16 Willingness to pay for connection to the piped water system and water supply quality improvement (Uritskoye settlement) %.
Source: Cadaster Institute, 2000e.
Lisogorsky District could potentially implement step-by-step reform of the utilities sector, which would include raising tariff rates for water supply services for the majority of the population, provision of additional paid services (e.g., water treatment) for wealthier people, and tariff preferences for lower-income residents. The monetary valuations of water helped to formulate proposals for adjusting tariff policy for water supply as part of utilities reform. The proposals were accepted by the administration of Lisogorsky District and Uritsky Okrug.
Parks, green spaces and trees are a vital component of the natural capital of town and cities and a prerequisite for maintaining biodiversity. While performing very important ecological and social functions, i.e., providing real benefits for people (as an aggregate of ecosystem services, including fresh air, attractive landscape, biotopes, recreation areas, etc.), they cannot “beat the competition” of short-lived, high-margin economic entities (parking lots, street stalls, etc.). For this reason, a large number of Russian towns and cities have experienced gradual decline in the area of their parks and green spaces in recent years. In this context, monetary valuation of such environmental sites, and proper account of their value when making decisions on the use of urban space, are of great importance for preservation of the natural environment in cities.
A number of studies of economic mechanisms to prevent loss of sustainability of the urban environment were carried out for Berendeyevka Park in the city of Kostroma and for the coniferous forest in the town of Kondrovo (Kaluga Region), following SNA/SEEA approaches. Monetary estimates of environmental resources and ecosystem services were derived using market and non-market (direct and indirect) valuation methods. The work was carried out by professional staff of Kostromadrevproyekt OJSC (Kostroma) and the Cadaster Center (State Budgetary Institution) (Kaluga). The project was based on information from local government bodies, the forestry department, statistical offices and public opinion polls.
Despite some differences between the subjects of research (e.g., size, types of services provided, possible uses, etc.), a common sequence of actions can be described for their evaluation and for implementation of the results obtained. The work involved the following steps:
- identification of the principal challenges to evaluation of the park and of the coniferous forest as regards their role in preserving urban biodiversity;
- identification of the environmental resources and ecosystem services provided by the site to residents, which should be given monetary valuation in order to develop mechanisms (economic, financial, administrative) to preserve the site;
- monetary valuations and derivation of total economic value of the site, data analysis;
- proposals for an economic mechanism of partial compensation to accrue to the site (as a market agent) in return for the services, which it provides, thereby preserving it and increasing its utility for the local population.
Berendeyevka Park
Berendeyevka urban park (Fig. 3.17) is situated in the northern part of the city of Kostroma. The park was created in 1963, since when its area has declined from 103 ha to 85 ha due to the creation of various facilities on its territory and sale of the land. Forest covers about 58.1 h of the park (mainly pine trees with some birch, aspen, etc., as well as occasional raspberry, ashberry and other underbrush). A number of ponds surrounded by trees with stylized Russian wooden huts (meant to evoke the fairy-tale Tsar Berendey) add to the charm of the park. The park is located within the city boundaries, is registered as a specially protected area and, due to its low earning power, has to be subsidized from the municipal budget.

Fig. 3.17 Berendeyevka Urban Park Map of the city of Kostroma %.
Source: Cadaster Institute, 2000a.
The forest of Berendeyevka Park, acts as a huge filter, cleans the air of dust and various sprays, absorbs carbon, provides oxygen and emits phytoncides suppressing disease-producing germs. The park is also extremely important socially: it is the favorite place of recreation for most city residents, it is easily reachable by public transport and admittance is free. All these factors make it an important recreation site, particularly at present when many people living in the city cannot afford vacations elsewhere. Local people believe that the park is now threatened by privatization, after which it would be used for purely commercial purposes, including residential development. Even now, large new houses are encroaching on the park from the direction of Severny settlement.
Monetary evaluation of the park’s ecosystem services was carried out in order to develop efficient mechanisms for preserving the park as a biodiversity oasis in Kostroma. The total economic value of the park was measured by three indicators: direct consumer value (based on direct market valuation); indirect consumer value (based on indirect non-market valuation); and existence value (based on direct non-market valuation). For better understanding of the findings, the calculation and comparison of the results were carried out in two versions:
1) economic value of the park in its current state;
2) economic value based on hypothetical complete felling of the park and subsequent use of the vacated area for commercial development.
1. Economic value of the park in its current state at the present rate of extraction of utility.
The direct consumer value of Berendeyevka Park was determined by returns from forest thinning, harvesting mushrooms and berries in its territory, and fishing. In compliance with environmental legislation, the territory of the park is only subject to minimal thinning as determined by forest management. The quantity of the fish catch and mushroom and berry harvesting were determined by surveys using data of the Kostroma Fish Inspectorate and Kostroma Forest Experimental Station. According to the estimates, the total direct consumer value of Berendeyevka Park was 15,500 rub./year (in 2000 prices), including:
- value of timber harvested – 4,600 rub./year;
- value of mushrooms and berries harvested – 10,200 rub./year;
- fish catch value – 700 rub./year.
The indirect consumer value of Berendeyevka Park was based on carbon sequestration capability. The estimate was based on the average biological productivity of coniferous and broad-leaved standing timber in the temperate climate belt, which is capable of absorbing 20-25 t/h of carbon dioxide or 5-5.5 t/h of carbon. The price of a ton of carbon was taken to be equal to US$10. The value of carbon absorbed by a hectare of woodland amounted to US$50, taking into account the species and age characteristics of the forest. Accordingly, the economic benefit in terms of air cleaning, provided by Berendeyevka Park with 58.1 h of wooded land, was 81,300 rub./year.
The existence value of Berendeyevka Park was determined by subjective valuation based on the perception of its value by Kostroma residents and their willingness to pay for its preservation in a well-tended and accessible form. Use was made of the data of opinion polls. The hypothetical willingness of residents to pay for the existence of Berendeyevka Park in free access for recreation was derived using an iterative procedure. The value obtained was 11.11 mln. rub./year.
So the total economic value of Berendeyevka Park as regards its ability to provide services to the city population was 11.21 mln. rub./year (Table 3.6).
Table 3.6 Value of Berendeyevka Park in its current mode of use
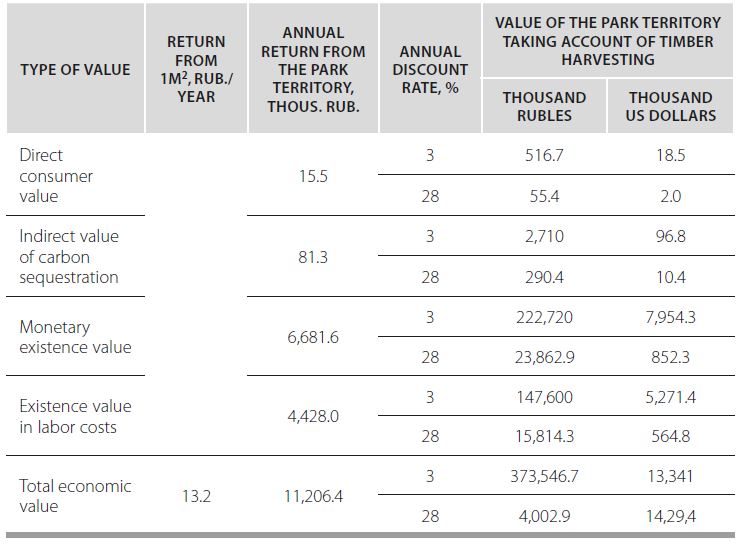
Source: Cadaster Institute, 2000a.
The greater part of the value is existence value (around 99%), including willingness to pay or make labor contributions for park maintenance (Fig. 3.18).
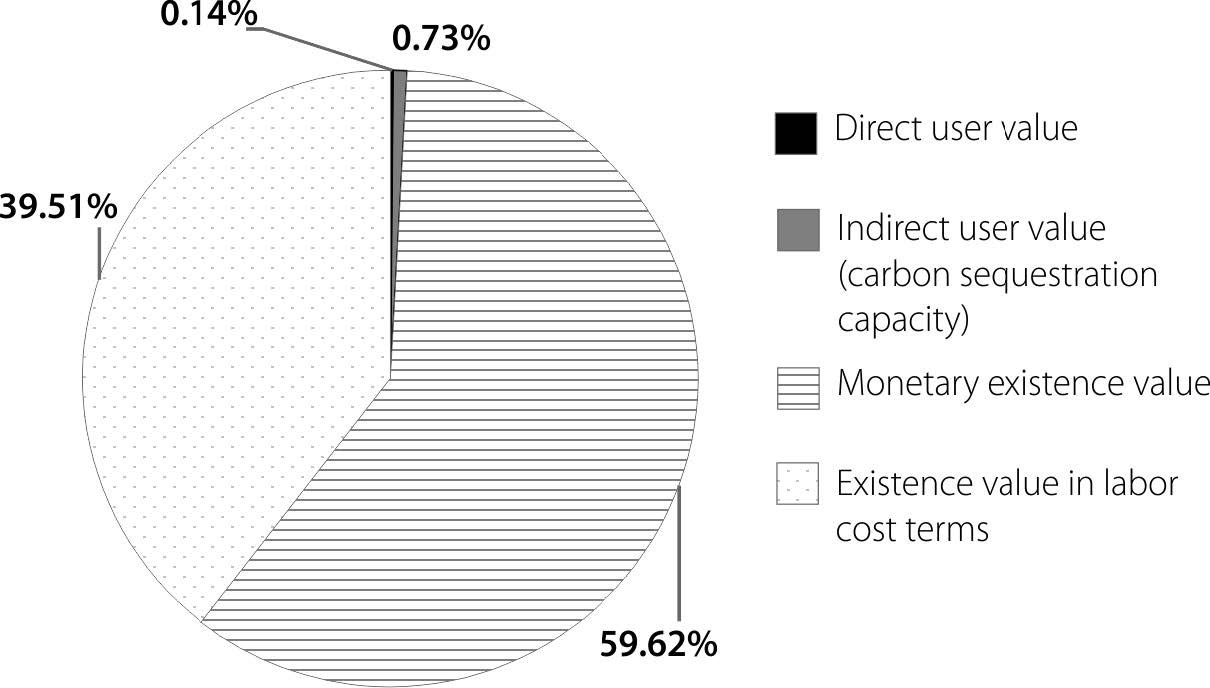
Fig. 3.18 Structure of total economic value of Berendeyevka Park %.
Source: Cadaster Institute, 2000a.
2. Economic value derived from complete felling of the park with subsequent use of the vacated territory for urban development, including: revenue from timber sales upon complete felling of the forest and budget receipts in the form of land tax on the newly acquired urban land. The valuation estimates are given in Table 3.7 which shows that the higher the annual land tax receipts, the greater the impact of the discount rate on the value of the territory. However, regardless of that, the use of the park as is looks much more profitable than its alternative utilization when considered from the point of view of preservation of biodiversity and the public interests of the city residents.
The crucial outcome of the ecosystem service valuation of Berendeyevka Urban Park was that the park started to “speak the language of money” for the first time and became a full economic agent. The findings obtained in valuation of Berendeyevka Park as a natural site playing an exceptional role in preserving urban biodiversity established the following points.
1. The total economic value of the park at the social discount rate of 3% is 373.5 million rubles (Table 3.7).
Table 3.7 Estimates of the park value if used as an urban development area
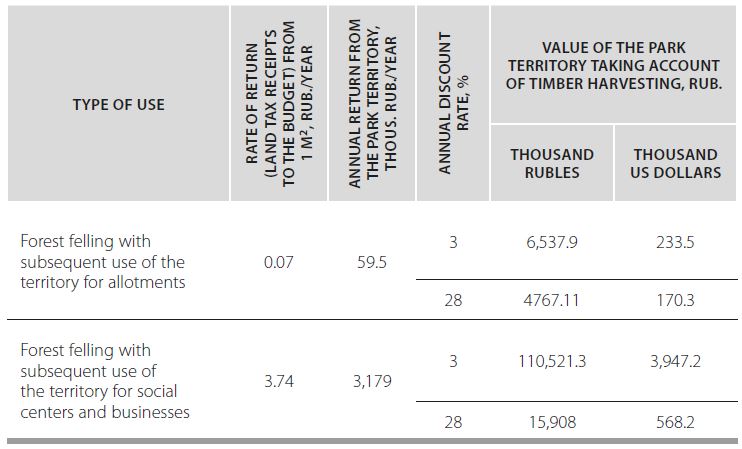
Source: Cadaster Institute, 2000a.
The economic value of the park is understated. At a discount rate of 28% (the rate of the Russian Central Bank at the time of evaluation) total economic value is only 40 million rubles, which is about 11% of the value calculated at the social discount rate (3%). So the current structure of the city’s sustainability capital is greatly distorted, with the value of parks and other natural resources and objects being undervalued. For this reason environmentally and socially significant innovations should be valued in two alternative versions. For socially significant items preference should be given to results obtained at the discount rate of 3%-7%, which corresponds to international practice (Dixon et al., 2000; UN, 1994a; 2000; etc.).
2. The park provides the city with the services whose economic value is 11.2 mln. rub./year (in 2000 prices). The largest part of services provided to city residents (Fig. 3.18) is the existence value of the park itself, which amounts to 99.1% of the total service flow. Carbon sequestration is an important function, amounting to 0.73% of the value of all services, while direct consumption of the park’s resources is negligible at 0.14%. Based on this approach, Berendeyevka Park should be judged to constitute one of the most ecologically, socially and economically important sites in Kostroma. Any plans, forecasts and programs of city development should regard the park as a self-sufficient economic actor, which entails adequate relations of partnership and compensation for the services provided (covering costs of regeneration and maintenance of the park by the municipal authorities and specific entrepreneurs who use the environmental services in their business, e.g., a restaurant operating in Berendeyevka Park)
3. The monetary valuation of Berendeyevka Park as a natural site, assuming its preservation in a well-tended and accessible state, gives a figure over three times greater than the value hypothetically accrued in case of its liquidation and alternative use of the land.
4. The comparison of returns from the park in monetary terms with land tax rates show that the park is substantially undervalued in the system of the urban land relations. Land tax rates in the park belt of Kostroma city are of the order of 0.1-3.7 rub./month, while the return on 1 m2 of the territory, calculated by monetary estimate of the services provided by the park, is 13.2 rub./m2 per year. So it is important, when measuring the wealth of the city (total sustainability capital), to take into account the total monetary value of the park and its services.
5. Adjustment of land tax rates is an important vector for improving urban management in Kostroma. The tax rates on land adjoining the park should be adjusted for two reasons. Firstly, residential development in areas directly next to the park increases pressure on plantations in the park, i.e., accelerates their “wear and tear”; secondly, people living on the edge of the park obtain additional benefits (health-related, recreational, etc.) from this vicinity, which are not reflected in payments for the land.
So tax rates on the land adjoining the park should be adjusted taking account of the ecosystem services enjoyed by those using this land. The additional funds should be used to finance quality control and preservation of the flow of ecosystem services provided by the park.
6. When land plots are to be sold for commercial projects (filling stations, retail outlets, etc.), the respective feasibility studies should include factual loss of sustainability capital, biodiversity and ecosystem services, incurred by the city. This would be in line with the recommendations of main international financial organizations and the practice of most countries.
7. Given the huge environmental and social significance of the park and the high economic value of its services, it should receive financing at least sufficient to retain it at its current functional level, avoiding any loss of its economic value. Consistent with international practice, expenditure on maintenance of the park should be kept at 2% of the total economic value of its services.
8. The involvement of ecologically minded activists, social groups and the general public in efforts to preserve the park would be very valuable. The feasibility of such involvement is shown by our surveys, in which nearly 45% of respondents expressed willingness to help keep the park clean and tending the plants. Assuming proper organization and ecological education, it would be possible to mobilize social groups that are highly socially motivated and have relatively low incomes (schoolchildren, students, pensioners). So it would be possible to organize a relatively low-cost labor force (consisting, particularly, of school students), even in market conditions.
Kondrovo Urban Forest
This regional nature reserve was established by a resolution of the Executive Committee of the Kaluga Regional Council of People’s Deputies (April 22, 1991, No.147). It is located on forest fund land on the right bank of the Shanya River and is administered by Kondrovo Forest Management (Dzerzhinsky Regional Forestry Department). The urban forest borders the town of Kondrovo on the western side and covers an area of 391 hectares. The forest consists mainly of conifers with patches of high-quality birch and aspen. Its primary value is ancient pinewoods, including trees that are 180-200 and even 300 years old in various parts of the forest. The average stock of timber is 300 m3/h. The standing timber is in satisfactory condition though some trees have suffered damage. The grass cover varies depending on the type of the forest and light conditions. As well as common species of herbage, there are some more unusual species, including anemone, lung-wort, bluebell and lily of the valley; species that can be harvested include berries (bilberry, strawberry, raspberry), mushrooms and nuts. The forest fauna includes wild boar, elks, foxes, martens, hares, squirrels and other small animals, as well as over 60 species of birds (crow, owl, woodpecker and tit, and, less commonly, hoopoe and cuckoo).
The protected area of the urban forest is crossed by railways (4 lines) and highways. Functional zoning marks out two protected areas in the urban forest: a 196 h area for mass recreation and 195.9 for forest tourism. Each of these has its own protection system and permitted forms of use. Observance of the forms of use is monitored by the Kondrovo Forest Management (part of the Dzerzhinsky Regional Forestry Department).
The valuation showed the following.
1. The direct use value consists of the value of the resources and benefits from their exploitation. At present, the forest territory contains 300 m3/h x 391 h = 117,300 m3 of coniferous timber. By rough estimates, based on the existing rates of timber duties, the price of commercial standing timber is 39.0 rub./m3, which means that the direct value of the timber is about 4.57 million rubles. However, environmental regulations forbid timber felling in the urban forest (only required thinning is permitted). The average selling price of harvested standing timber as fuel wood was 1.35 rub./m3 in 1997. Thinning provided 240 m3 of timber, so the total value of the fuel wood obtained is 300 rubles. Mushrooms, berries and medicinal herbs also have a certain value. Their monetary valuation was based on the results of public opinion polls (Table 3.8). The direct value of timber resources in the urban forest is 8.4 million rubles (as derived from fuel wood, mushrooms, berries and medicinal herbs).
Table 3.8 Valuation of non-timber forest resources of Kondrovo Urban Forest
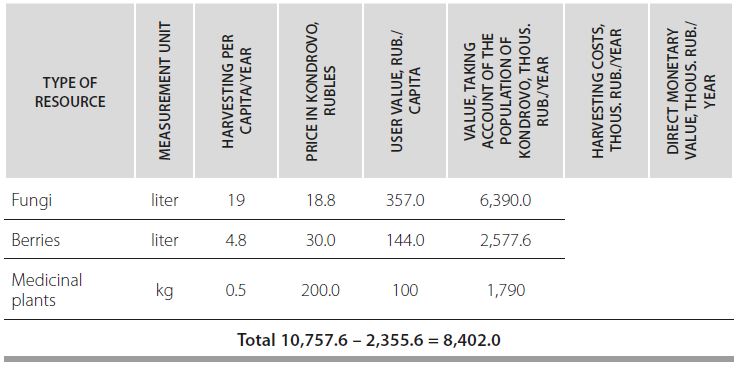
Source: Preobrazhensky, Fomenko G., Fomenko M., Loshadkin & Arabova, 1999.
- The indirect user value of Kondrovo Urban Forest was determined on the basis of its carbon sequestration capability and amounted to 488,750 rubles.
The main monetary estimates are presented in Table 3.9.
Table 3.9 Monetary estimates of Kondrovo Urban Forest

Source: Preobrazhensky, et al., 1999.
The valuation shows that the user value of the site (8.89 mln. rub./year) is much higher than the hypothetical returns on exploitation of the forest as a “supplier” of timber (the direct value of complete felling is 4.57 million rubles).
So monetary valuation of Berendeyevka Park in Kostroma and the Urban Forest in Kondrovo showed that such valuation (including non-market, subjective criteria) is feasible and very useful for high-quality forests, specially protected areas and sites of natural and cultural heritage, which have multipurpose use and provide environmental and social benefits.
The user value of these objects is substantially higher than probable income from hypothetical felling of the timber and its subsequent sale. The high existence value of such sites proves the strong commitment of local residents to their preservation and suggests practical mechanisms for achieving it. Such mechanisms include: the introduction of a special-purpose tax on a case-to-case basis or a special charge as part of the general utilities service tax; public control over the creation and use of the respective fund by establishment of a supervisory committee of respected city residents; and conduct of an ongoing information campaign to explain the importance and significance of the site.
By using the SEEA methodology, decision-makers can take account of the environmental and social requirements for creation and preservation of natural and cultural heritage sites and of recreation facilities. Their adequate valuation enables appropriate adjustments to cadastral estimation of the land, which make it more reliable and economically justified and more environmentally and socially inclusive.
The pursuit of sustainable use of natural capital in Russian regions implies a similar approach at the sub-regional level. Although most rural territories seem to be free of major environmental hazards, which are typically caused by big industrial and infrastructure facilities, vulnerability factors in the countryside include a considerable environmental component due to the nature of economic activities in the relevant territories.
Many peripheral and semi-peripheral rural areas in Russia are experiencing chronic depopulation. Problems that arise in this context (fewer job opportunities, remoteness of health services, utilities, schools, etc.) force households to focus on physical survival. The sense of value and scarcity of the non-renewable natural environment is then lost and people perceive nature as a mere source of subsistence, without any conscious desire to preserve its wealth. Areas in central Russia, particularly rural territories, are under strong pressure as more and more land is used for residential development, summer houses and villas. In these areas the growing numbers of residents (especially seasonal holidaymakers) exacerbate problems related to water supply, garbage disposal, destruction of forests and other natural features, and sometimes even free access to what had previously been public spaces.
Rural settlements suffer particularly from a chronic lack of investments. Communities are plagued by actual poverty in a context of deteriorating demographic situation, the breakdown of economic links, loss of local crafts, erosion of cultural foundations, and the destruction of traditional institutions of local government. The poorest rural communities perceive environmental regulations as hostile to their welfare and destructive behavior in respect to the most accessible shared natural resources (forest and plant felling, poaching, etc.) is an ever greater problem. Many rural people today neglect collective responsibility for securing public interests, ignoring laws and violating environmental traditions that had previously seemed sacrosanct.
So the issue of environmental protection and natural resource replenishment in the countryside cannot be considered in isolation from social and economic problems. These problems cannot be addressed without up-to-date, quality information on regional resource management and environmental protection, which would make it possible to appraise different investment strategies based on economic analysis and the distinctive features of specific territories.
Such work, based on SNA/SEEA approaches, has been carried out by the Cadaster Institute in various regions of Russia (Yaroslavl, Tomsk, Kaluga, Ryazan, Saratov Regions, Republic of North Ossetia-Alania, and others).
In Yaroslavl Region, a pioneering project for systematic monetary valuation of main natural resources at local level was carried out on the basis of the SEEA and was included in the Program for Environmental Protection and Resource Use of Danilov Municipal District. The project was completed in 1996-1997 under an agreement on monetary valuation of natural resources of Yaroslavl Region, made between the Russian State Committee for Environmental Protection, the Administration of Yaroslavl Region and the Cadaster Institute106 . The project was the first attempt in Russia to use SEEA approaches at the local level, including “white” and “gray” matrices. The results obtained not only proved the possibility of using market methods of monetary valuation of natural resources but demonstrated their efficiency for finding ways to improve environmental management and nature protection.
The studies in Iraf District were carried out in a 2005 project in the Republic of North Ossetia-Alania, initiated at the request of the Department of the Federal Service for Environmental Supervision in the Republic. The purpose of the project was to find ways and methods of using SEEA methodology at sub-federal and municipal levels in Russian conditions (i.e., given Russia’s legislative base, the state of statistical and departmental accounting, socio-cultural peculiarities of environmental management, etc.).
A number of projects were carried out in Pervomaisky District of Yaroslavl Region, namely, “Proposals for improving the regulatory and legal framework and fees for the use of mineral resources in Pervomaisky District of Yaroslavl Region” (1994), “Proposals for territorial accounting of natural resources in Pervomaisky District of Yaroslavl Region” (1998), “Proposals for the use of timber resources in the north-east of Yaroslavl Region (as exemplified by Pervomaisky District)” (2001), “Proposals for improving the efficiency of the use of natural resources in municipal districts of Yaroslavl Region (as exemplified by Pervomaisky District)” (2003), etc. These projects were undertaken at the request and with the support of the Administration of Yaroslavl Region, the Administration of Pervomaisky District and other sponsors. They applied SEEA approaches for identifying potential area of sustainable use of the local resource base (plywood production, rural tourism, harvesting and processing of non-timber forest products) and developing investment feasibility studies for specific business projects. The reorientation of economic activities, suggested by these projects, can provide new jobs for local people and replenish the budget, increase the economic value of natural assets in the District and motivate the business community to engage in resource preservation, preventing its environmentally and socially dangerous depletion.
Danilov District is situated in the north-west of Yaroslavl Region, and is centered on the town of Danilov (a major junction of the Northern railway system). The District is traversed from north to south by the Moscow-Kholmogory federal highway. Danilov is 75 km from Yaroslavl, 120 km from Vologda and 375 km from Moscow. Danilov District has an area of 2,211.6 km2. The relief is level and elevated with low ground along the river and stream valleys, stratified by watershed divides. Height above sea level in the District ranges from 120 to 165 m.
The District contains 563 towns and villages, 393 (70%) of which have permanent residents. The population (as of January 1, 2015) was 25,700, including 15,100 urban and 10,600 rural residents.107
The valuation was carried out with respect to public water supply, timber resources and Gorushka forest which are used for multiple purposes.
Water in the public water supply system
Description of the situation
Settlements in the Districts were divided into the following types for characterization of their water utilities:
– Danilov town (and suburbs)
– urban settlements, the population of which is mainly engaged in farming, and which are composed of blocks of buildings (usually central farmsteads of agricultural entities);
— villages, which are dispersed, scattered rural settlements with various types of buildings and without any central core.
These distinctions are important because the differences in housing density and organization largely determine the type and specifics of the existing water supply systems. Three types of water supply systems were identified: piped water to internal taps; outside (street) water hydrants (standpipes); wells, springs, etc. (Fig. 3.19). The studies were carried out based on the typology of settlements described above.
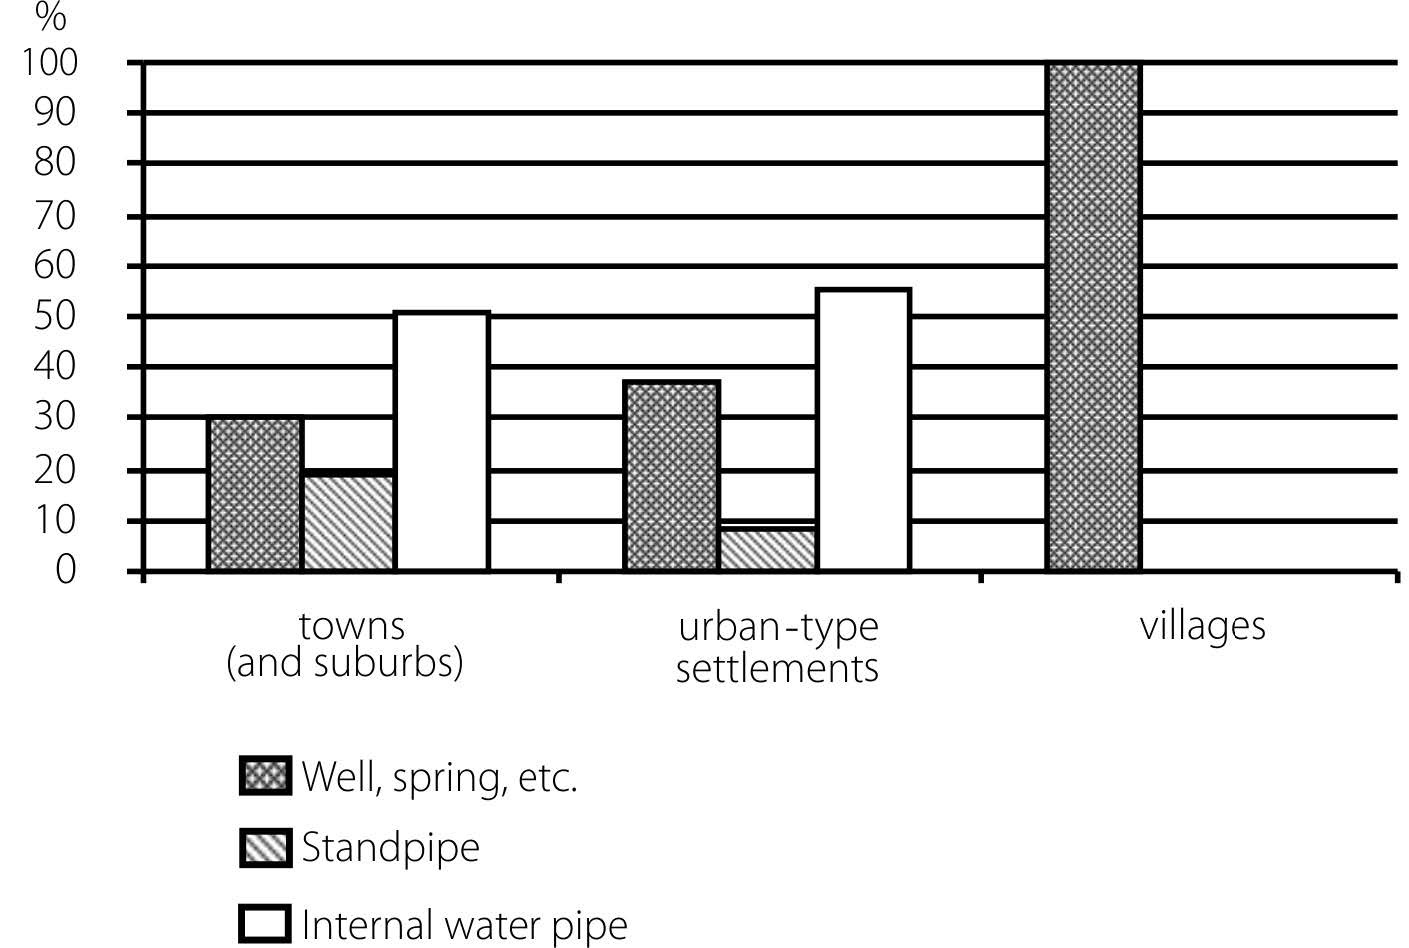
Fig. 3.19 Different water supply systems by type of settlement
Source: Loshadkin, 2001.
Water supply in Danilov is provided from underground springs by the municipal utility and by several economic entities that have their own wells. Most of the water is consumed from:
— the Kinderev water source, located 12 km from the town (water is transported through worn-out pipes and contains an excessive quantity of iron and other admixtures);
— Gorushka water source inside Danilov town (the source is over-used);
— small water wells, some of which are not exploited and may contaminate groundwater.
A sample survey was carried out in order to evaluate water supply quality in Danilov town. The results showed that residents are concerned about the water quality (55% of respondents) and reliability of its delivery to homes (65% of respondents). People often have to resort to other sources (mostly wells), in addition to piped water, in order to obtain water of good quality or in case of supply stoppages. Nearly everybody who uses municipal piped water supply takes preventive measures to improve the water quality by boiling (80% of respondents), settling (48%), filtration (30%), or by using other water sources or other liquids (40%) and 72% use more than one preventive measure.
Generally, the quality of the municipal piped water supply is very low. The main reason for this is chronic underfunding of water supply utilities. The revenue received by utilities (the service charges paid by the general public and subsidies provided by the state) cannot cover expenditures on water supply. The result is poor functioning of the public water supply system, which leads to increased pressure on the town’s wells, particularly those in private ownership.
The water supply in the District’s urban settlements and villages is provided as follows: via water pipe systems maintained by local utilities or agricultural enterprises (in bigger settlements); from wells, boreholes and springs (in public or private ownership); from rivers and ponds (water not for human consumption); and rainwater from roofs.
The numerous transformations of Russian agriculture during the 20th century took their toll on the rural water supply. The consolidation of agricultural enterprises and liquidation of “unpromising” villages led to the appearance of many urban settlements in the 1970-1980s. Without going into detail on the problems caused by this trend, some issues that are relevant to the water supply sector should be mentioned.
Construction and servicing of blocks of flats with modern conveniences was feasible in the planned economy when sufficient centralized investments were available. The focus then was on the creation of centralized water supply systems while maintenance of wells and other traditional water sources was neglected. When post-Soviet reforms began, the water supply deteriorated sharply due to the lack of funds: subsidies were abolished and the purchasing power of the general public declined. People living in densely inhabited apartment blocks are most disadvantaged, because they receive low-quality water with frequent interruptions (as confirmed by the surveys) and have only limited access to other sources of water. The dramatic cut in financing of main water supply systems has been accompanied by a decline in the number of water sources (wells, boreholes, springs) in public use and increase of privately owned water sources, due either to the creation of new sources or “privatization” of existing sources, which had previously been abandoned and have been restored by new owners at their own cost.
Water fees are charged according to tariffs introduced by the local administration; they are formally linked to the quality of housing, but are factually the same for all types of water supply (a tap inside a dwelling or an outside standpipe) and ranged from 0.20 to 0.21 rub./m3 in 1996. This compares with factual cost of 4.83 rub./m3 for the municipal water utility to deliver 1 m3 of water to the piped system. The difference is made up by state subsidies and reallocation of municipal budget revenues received for other services. Connection to the water supply system is at the customer’s expense and the price depends on specific conditions (distance to the existing water mains, its condition, etc.)
Water uptake from wells, boreholes, springs and other sources is free of charge. A part of the funds for the maintenance of such water sources is collected by administrative territories (former village councils) from the voluntary contributions of residents. For example, in 1996 the amount of such voluntary contribution in Semlovo administrative territory, where a survey was carried out, was 2 rubles per permanent resident and 4 rubles per summer vacation resident; about 30% of this amount was spent on maintenance and repairs of the wells, representing very small sums.
In these circumstances there is an urgent need to allocate efforts and funding in a more efficient way in order to improve public water supply systems. The first requirement is to understand which services are the most important for users. Danilov town, Semlovo urban settlement and several villages in Semlovo administrative territory were chosen as sample sites for deriving the following water estimates:
— direct market valuation was carried out by comparing water payments charged to the users with the current cost of water treatment and delivery;
— direct non-market valuation was carried out on the basis of consumers’ willingness to pay for the water supply services, followed by comparison of the amount obtained with the current cost of water treatment and delivery;
— indirect non-market valuation used data on the actual or hypothetical costs incurred by water users for improvement of their water supply quality.
Monetary estimates for water in the public water supply system of Danilov municipal district are presented in Table 3.10.
Table 3.10 Monetary estimates for water in the public water supply system of Danilov municipal district
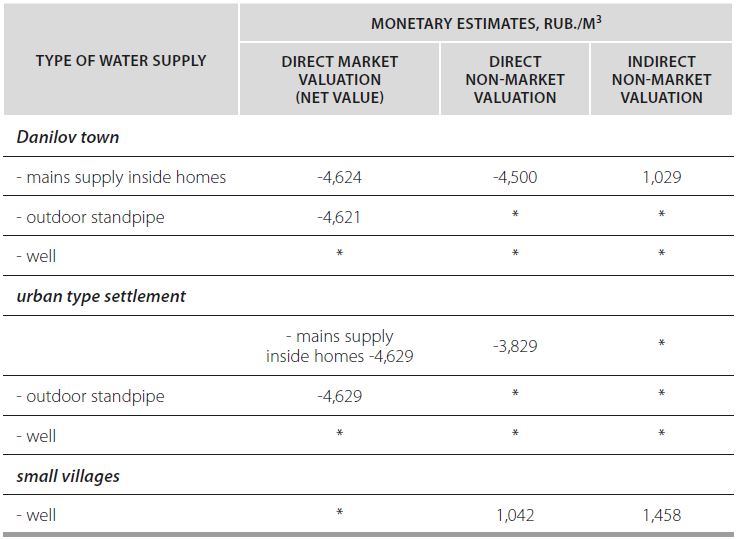
Source: Cadaster Institute, 1997b.
The findings justify the following conclusions.
1. Water charges are far lower than the cost of water supply for all categories of users. Consequently, net water value is a negative amount. However, the direct market valuation is not definitive as it neglects the users’ attitude to the value of water (based on their willingness to pay).
2. Willingness to pay for water supply (direct non-market valuation) was determined for three levels: town, urban-type settlements and villages. In Danilov town, 54% of households expressed willingness to pay for connection to mains water, but the average amount they are willing pay is only 145 rubles, while the actual cost would be much higher. Willingness to pay for uninterrupted supply of high quality water was also low, at 0.33 rub./m3 (cost for the municipal water supplier of delivering water is over 4.83 rub./m3). It is clear that water is undervalued for a number of reasons: first, low household income level; second, distrust of the authorities who may fail to provide services of the proper quality; third, entrenched belief that water should be supplied at a very low price (or even for free). We can see, however, that, although very low, the value determined by willingness to pay exceeds the existing service charge.
3. The cost of measures undertaken by households themselves to improve their water supply offers a more helpful approach to water valuation. Using this method, we obtained value of water supply improvements of 17,500 rub./month per household.
4. The results derived for urban settlements are similar to those described above. Actual payments do not cover the cost of water supply. Also, payments are not differentiated by the type of service; e.g., water consumed from outside standpipes is paid at nearly the same rate as running water in the home. The study showed that willingness to pay for mains water in the home was around 5 rub./month per capita, i.e., 1.0 rub./m3. Rural households use a lot of water (for livestock handling and other needs), which explains higher value stated for the service.
5. Villagers show little interest in running water inside the home, but willingness to pay for drinking water of high quality was evaluated at about 20 rub./m3 and at 2-3 rub./m3 for household needs. Low willingness to pay was also obtained in respect of well water, due to user costs of the time spent on uptake and transport of the water. The value was 1.5 rub./m3.
The main findings of the study were that water charges can only be increased to a very small extent, which limits potential for raising the earnings of the water supply system. It is important, however, that it might be possible to charge amounts equal to willingness to pay. Supporting households in their efforts to create and preserve water supply systems is particularly important. Another issue deserving attention is the possibility of loans to households to fund connection to mains water. It may also be possible to adjust payments so that users with higher willingness to pay do actually pay more (e.g., for additional treatment and purification of running water inside apartments by the utilities, additional fees for summer vacationers, summer use of piped water for gardening, etc.) This would be helpful as many users are only willing to pay for water below its cost, so compensation is needed to cover the costs of providing water to them. Additional studies are needed in order to determine the level of potential concessions to households with low willingness to pay, and suitable increase of payments for consumers with higher willingness to pay. The data obtained thereby could be used to develop programs for improvement of the public water supply.
Timber resources
Description of the situation
Nearly 53.4% of the area of Danilov District is covered by forests. The forests are divided into some that are exploited and others that are protected. The forest consists mainly of broad-leaved trees. Forests play a significant role in the economy and social life. Forest land is used for livestock grazing and haymaking, harvesting of mushrooms, berries and herbs, sport and commercial hunting. Some forest areas perform important ecological and recreational functions.
The studies revealed main issues in the sphere of forest management. Here, as in many other central regions of Russia, there has been a reduction of official extraction and processing of timber resources and increased pressure on coniferous forests (particularly in areas easily accessible by road transport) from illegal felling. The forests that are illegally felled are often those that provide protective functions (first-group forests).
Forest management in Danilov District is the responsibility of the Danilov Forestry Department of Yaroslavl Forest Administration (six forest farms) and Danilovsky Interfarm Forestry, controlled by Yaroslavlselles LLP. The industry suffers from contradictory standards, poor allocation of responsibility by managing organizations, inefficient taxation and lack of investment. Wood processing is at a very low level. The critical situation was underscored by failure to hold auctions for the timber harvesting contract in 1996. This was explained by a number of factors: most local consumers and potential contractors lacked money, the timber put out to tender was uncompetitive (by price and quality), and some potential contractors were able to obtain timber at a minimum price (or even for free), bypassing the auction.
There is a range of issues connected with preservation of forests that have special environmental status. These forests have particular need of approaches that respect multipurpose use because they are the ecological “backbone” of the territory, playing a special role in maintaining environmental stability, but also have important social functions, e.g., recreation (often in combination with non-timber product harvesting, fishing and hunting, i.e., direct income) and high spiritual significance. The integrated, sustainable use of the environmental resources and ecosystem services provided by unique forests cannot be resolved without an adequate system of measures based on monetary valuation of the use of such resources.
Monetary valuation of one particular forest zone in Danilov District, the suburban Gorushka forest area, was carried out in respect of its timber value and its other values as an SPA. The valuations can help to find ways of improving the efficiency of forest use in Danilov District as a whole.
Results
Timber valuation Monetary estimates of timber resources were derived for: legal and illegal trade in timber; use of timber by households. We used the method of direct market valuation based on value of the final use of the timber less the cost of timber harvesting and processing, which includes wood cutting, forest regeneration in the area of felling, sawing cost, etc.; however, license fees for felling rights and any paid taxes were not deducted.
In legal trade, the timber value should be based on tender prices, if tenders are held. However, in case of a failed tender, the calculation was based on a standing timber tariff of 170 rub./m3 for conifers and 90 rub./m3 for broad-leaved trees. Cost of harvesting is set based on rates of the Danilov sawing mill and ranges from 6-14% of the coniferous timber price to 1-23% of the broad-leaved timber price. Accordingly, the monetary estimates are 10.2-40.8 rub./m3 for conifers and 0.9-20.7 rub./m3 for broad-leaved timber. These values are then scaled to the total value of legal harvesting.
Timber valuation in illegal trade is difficult because data on the shadow economy is scarce. Illegal trade is mainly conditioned by the low living standards of the rural population and lack of adequate supervision of felling. Estimates of illegal consumption must be made, because it happens on a large scale and shows no signs of diminishing. Estimated prices on the illegal market are based on the timber trade in the areas where felling is prohibited. They are generally lower than official prices. According to preliminary expert estimates, about 30% of timber is cut illegally and without payment. The net value of illegal felling, i.e., the gross value of the timber, is lower than the cost of felling and ranges from 0 to 20 rub./m3.
When estimating the monetary value of timber used by households, the focus was on identifying the methods of timber consumption and specifying its amounts. Considerable amounts of timber consumed by households are not recorded in official accounts, as the timber is often harvested illegally. We determined the amount of the timber consumed by the household sector as part of our research. Drawing on survey data, we found that one household annually consumes 2.7 m3 of commercial timber (usually conifers) and 14.6 m3 of fuel wood. These data were used to determine the total volume of timber consumed by households in Danilov municipal district, which is far in excess of official accounting. The value of final consumption was derived from timber tariffs (by analogy with the case of legal trade), harvesting cost was determined based on actual costs of households (drawing on survey data).
Results of the monetary valuation show that the net value of the timber is considerable. It is much higher than the sum total of tax revenues, even excluding the value of commercial use of timber. According to preliminary estimates, the actual amount of tax revenue is only 16% of the net value. Given the current low demand for timber, what is effectively occurring is subsidization of the rural population by that amount. Judging by the practice of other countries, it is advisable to adopt a case-by-case approach as the economy recovers, setting timber prices with due account for the purchasing power of different social groups. Otherwise, the highest income will be received by the wealthier social groups.
Summing up, the results obtained so far provide a basis for future work to find solutions that can prevent illegal timber felling and enable a broader view of monetary estimates of timber in its various uses. In a context of low household incomes, payments for the use of timber resources should promote efficient management of forest wealth.
Valuation of Gorushka forest in its multipurpose use The Gorushka Park state nature sanctuary in the south-west of Danilov town is a 122 hectare forest more than 100 years old. The main species is pine with some fir trees; the forest understory contains mountain ash and honeysuckle. Gorushka is the favorite place of recreation for town residents. The forest also has an important spiritual significance as it is the former site of an Orthodox church, which was destroyed in the 20th century. According to research, the forest also plays a major role in cleansing ambient air in the town by generating cold air streams at nighttime. The surrounding ground relief promotes night air exchange, removing warm polluted air from the town streets. So the town’s ambient air is cleansed by a natural mechanism. Urban development is approaching the forest boundaries, obstructing this natural process, making negative inputs to the air circulation. So preservation of Gorushka Park is of great importance from a social and spiritual perspective, and also for maintaining healthy climate conditions in the town.
The studies were aimed at determining the total economic value of the natural resources and ecosystem services provided by Gorushka to the residents of Danilov, taking into account its user value, both direct and indirect, and its existence value.
Given the special environmental status of the site and practical ban on timber extraction (only required thinning is permitted), the direst user value of the timber is derived from the value of the fuel wood harvested. The volume of logging is estimated on the basis of respective standards, while its value is determined by the average selling price. Mushrooms and berries also have some value, though their quantity is not substantial. Recreation in the Park is free of charge (no admission tickets are sold, which would have helped to establish direct user value). There no other comparable user values at Gorushka Park.
Due to the predominantly recreational use of the timber resources in Gorushka Park, their direct value is negligible, amounting to 1.1 mln. rub./year (by the value of fuel wood). So the direct value estimate of Gorushka fails to capture its actual significance for Danilov residents or to prescribe, even in the broadest terms, mechanisms for maintenance and protection of this site, which is so precious for the town.
The indirect user value is based on the forest’s carbon sequestration capacity. The estimate was based on the average biological productivity of coniferous and broad-leaved standing timber in the temperate climate belt, which is capable of absorbing 20-25 t/h of carbon dioxide or 5-5.5 t/h of carbon. The price of one ton of carbon was taken to be US$10 per ton (see IPCC, 1996). The value of the carbon absorbed from one hectare of the forest was on average US$50, taking into account the species and age characteristics of the forest stand. The economic benefit of ambient air cleansing by Gorushka forest was estimated to be about 34,800 rubles.
Existence value was determined by the method of subjective valuation (willingness to pay). Hypothetical willingness of Danilov residents to pay for the existence of Gorushka as a well-tended forest park with free access for recreation was derived from opinion polls, using an iterative procedure.
Estimates of willingness to pay in monetary terms (willingness to contribute a certain amount of money, on average 2.7 rub./year per capita) and non-monetary terms (willingness to contribute labor, on average 1.3 days/year per capita) suggested existence value of Gorushka equal to 215,100 rub./year. This confirms the high value of the Park for residents and their willingness to participate directly in the preservation of Gorushka as a public recreation site, nature sanctuary and the home to the church (spiritual value).
The results of monetary valuation of Gorushka Park (Table 3.11) produce the following conclusions.
Table 3.11 Monetary valuation of the Gorushka Park state nature sanctuary
|
Type of estimate |
Derived estimate, mln. rub. |
|
Direct user value |
1.1 |
|
Indirect user value based on carbon sequestration capacity |
34.8 |
|
Existence value determined by subjective valuation (willingness to pay) |
215.1 |
|
Total |
251 |
Source Cadaster Institute, 1997b.
1. The park has high user value, primarily as an important environmental site performing the functions of carbon sequestration and cleansing of the town’s ambient air, rather than merely as a “supplier” of timber resources.
2. The existence value derived by subjective valuation (based on the willingness to pay) was about 215 million rubles per year, expressed partly in monetary terms and partly in labor contributions. The economic value of the park at the social discount rate of 3%, as determined on the basis of existence value, would be 7.17 billion rubles. This is a high value, being over seven times that of direct income from hypothetical complete felling of the forest, which would, according to aggregated estimation, provide about 1 billion rubles over 30-year service life (forest maturity time).
3. Because of the challenging economic situation, the existence value has two components (monetary estimate and labor input). This means that not only is Gorushka important for Danilov residents, but they are willing to take an active part in the preservation of the Park, which is used for recreation and is a natural and cultural heritage site.
In these circumstances, it would be expedient to set up a fund to collect contributions (perhaps differentiated by areas of the town) for Park maintenance, which would be spent on volunteer clean-up events to be organized by the Danilov saw mill (the organization in charge of the Gorushka nature reserve, as ruled by the Resolution by the Small Council of the Regional Council of People’s Deputies (May 27, 1993, No.118), “On Specially Protected Areas in Yaroslavl Region”)).
The area of Iraf District in Republic of North Ossetia -Alania is 137.6 million hectares, including agricultural territories of 45.56 million hectares and an area of 30.253 million hectares devoted to industry. The administrative center of the District is the village of Chikola. Iraf District is rich in natural resources that have strategic significance for the Republic’s economy, including complex ores, minerals, hydrominerals, recreation resources, natural forage land, hydropower resources, etc. Iraf District is traversed by a highway across the Kunchi mountain ridge, although there is no railway transport. As of January 1, 2005, the number of the permanent residents of Iraf District was 704,394, of whom 243,740 lived in rural areas.
Iraf District has a low level of industrial development. The district has several industrial and construction enterprises and a diversified small-scale agricultural sector.
Agriculture The agro-industrial sector in Iraf District consists of 10 publicly owned establishments. There are 59 farms and a large number of household farming plots, growing large volumes of agricultural produce. The area of farm land is 45,560 hectares, including 9,327 hectares under the plow and 11,210 hectares of pasture and hay fields.
Crops are dominated by grain. The farms grow winter wheat, corn, potatoes and vegetables. Soya beans have been recently introduced in the District as a new crop. Gross output in 2004 was 5.89 million rubles, which is 4.8 times more than in 2003. Cattle are bred for milk and meat production. As of January 1, 2005, the district had 4,377 farmsteads, which have maintained stable numbers of livestock over the last three years. At the beginning of 2005, household farming plots in the district had 17,000 head of cattle.
An SEEA matrix in physical terms was derived for Iraf District, based on available data concerning supply and use of natural resources, including statistical, departmental and expert data, and also on the results of household surveys,
Table 3.12 Physical accounts: non-produced economic assets (renewable, non-renewable resources) Matrix

Source: Cadaster Institute, 2006d.
Derivation of the SEEA matrix in monetary terms for Iraf District is based on estimates of the value of the stock and their change for the following main groups of natural resources, whose consumption is significant for the social and economic development of the District:
- water resources – surface water and ground water;
- non-timber resources;
- carbon sequestration by forests;
- farm land.
Felling operations on the forest fund territory of Republic of North Ossetia-Alania has not been permitted since 1994 (Decree of the Council of Ministers of the Republic of North Ossetia-Alania, dated October 21, 1993 No.100, “On Preservation and Reinforcement of the Environment-Forming Properties of Forests”), so there has been no commercial timber harvesting. Therefore, we did not derive monetary values of the stock of timber resources. Game resources were not evaluated due to lack of data. Official hunting of game animals in Iraf District probably occurs but in limited amounts since most of the District is occupied by the Alania National Park where hunting is prohibited. Monetary estimates of fishing resources in Iraf District were not derived due to the absence of any information on the volume of commercial catch of fish, its cost and market price. Data on illegal catch are also lacking. It is therefore recommended that further studies should be planned for deriving monetary valuation of the above-mentioned resources, so that SEEA principles can be applied in Iraf District and other regions of North Ossetia-Alania.
Water resources
To derive monetary estimates of water resources, we used tax charges for the use of water bodies, received by the territorial budget in 2004.
Opening value of the stock
We used the following data to derive the opening value of the stock of surface and ground water:
- the net value of surface and ground water was taken to be 0.063 rub./m3;
- the consumption of surface and ground water was taken to be constant over 100 years at 0.264 mln. m3/year;
- the discount factor is 31.6 at an annual rate of 3%.
The monetary value of surface and ground water was 0.526 million rubles at the beginning of 2004.
Economic use
Sustainable use Valuation of the economic use of the stock was based on the following data:
1) the net value of surface and ground water was taken to be 0.063 rub./m3;
2) the consumption of surface and ground water was 0.264 mln. m3/year in 2004.
The monetary value of surface and ground water was 0.017 mln. rub./year.
Depletion. No depletion of surface and ground water is observed at the present time.
Other accumulation This represents natural replenishment of the stock of surface and ground water. The following data were used in deriving this estimate:
- the net value of surface and ground water was taken to be 0.063 rub./m3;
- the consumption of surface and ground water was 0.264 mln. m3/year in 2004.
Thus, the estimate of other accumulation was 0.017 mln. rub./year.
Closing value of the stock
In deriving the closing value of the resource stock the following data were used:
- the net value of surface and ground water was taken to be 0.063 rub./m3;
- the consumption of surface and ground water was taken to be constant over 100 years at 0.264 mln. m3/year;
- the discount factor is 31.6 at an annual rate of 3%.
The monetary value of surface and ground water was 0.526 mln. rub. at the end of 2004.
Non-timber resources
The resources to be valuated included medicinal plants (Saint-John’s wort), berries (rosehip, etc.), mushrooms, hazelnut, plane.
Opening value of the stock
In deriving the opening value of the stock of non-timber resources we used the following data:
1) average market prices of non-timber resources: medicinal plants and berries harvested by forestry farms – 8.8 rub./kg; mushrooms, berries and other products harvested by the general public – 70 rub./year;
2) cost of non-timber resource harvesting: medicinal plants and berries harvested by forestry farms – 1.8 rub./kg; mushrooms, berries and other products harvested by the general public – 14.3 rub./kg. The harvesting cost is given according to the average harvesting prime cost across Republic of North Ossetia-Alania (forestry data) and Iraf District (survey data);
3) the volume of harvesting of non-timber resources was taken to be constant over the accounting period (100 years) at 0.35 t/year for medicinal plants and berries harvested by forestry farms and 53.5 t/year for mushrooms, berries and other products harvested by the general public;
4) the discount factor is 31.6 at an annual rate of 3%.
5) The opening monetary value of the stock in 2004 was 0.077 mln. rubles for medicinal plants and berries harvested by forestry farms and 94 mln. rubles for mushrooms, berries and other products harvested by the general public.
Economic use
Sustainable use The following data were used to derive the return on economic use of resources:
- average market prices of non-timber resources: medicinal plants and berries harvested by forestry farms – 8.8 rub./kg; mushrooms, berries and other products harvested by the general public – 70 rub./year;
-
cost of non-timber resource harvesting: medicinal plants and berries harvested by forestry farms – 1.8 rub./kg; mushrooms, berries and other products harvested by the general public – 14.3 rub./kg.The harvesting cost is given according to the average harvesting prime cost across Republic of North Ossetia-Alania (forestry data) and Iraf District (survey data);
- the volume of harvesting of non-timber resources was taken to be constant over the accounting period (100 years) at 0.35 t/year for medicinal plants and berries harvested by forestry farms and 53.5 t/year for mushrooms, berries and other products harvested by the general public;
The monetary value of the economic use of the stock was 0.0025 mln. rub/year for medicinal plants and berries harvested by forestry farms and 3 mln. rub./year for mushrooms, berries and other products harvested by the general public.
Depletion There were no signs of depletion of non-timber resources.
Other accumulation
The volume and value of the natural reproduction of resources was taken to be adequate to the volume and value of their economic use.
Closing value of the stock
In deriving the opening value of the stock of non-timber resources we used the following data:
- average market prices of non-timber resources: medicinal plants and berries harvested by forestry farms – 8.8 rub./kg; mushrooms, berries and other products harvested by the general public – 70 rub./year;
-
cost of non-timber resource harvesting: medicinal plants and berries harvested by forestry farms – 1.8 rub./kg; mushrooms, berries and other products harvested by the general public – 14.3 rub./kg.The harvesting cost is given according to the average harvesting prime cost across Republic of North Ossetia-Alania (forestry data) and Iraf District (survey data);
- the volume of harvesting of non-timber resources was taken to be constant over the accounting period (100 years) at 0.35 t/year for medicinal plants and berries harvested by forestry farms and 53.5 t/year for mushrooms, berries and other products harvested by the general public;
- the discount factor is 31.6 at an annual rate of 3%.
The closing economic (monetary) value of the stock in 2004 was 0.077 mln. rubles for medicinal plants and berries harvested by forestry farms and 94 mln. rubles for mushrooms, berries and other products harvested by the general public.
Carbon sequestration by forests
The following data were used derive economic value of the carbon sequestration capacity of the forests:
- during the vegetation period forests in the temperate climate belt are capable of absorbing 5-5.5 t/h of carbon or 20-25 t/h of carbon dioxide;
- the carbon sequestration capacity of the territory is taken to be 5 t/h;
- the total area of Iraf District forests is 28,400 h;
- the value in terms of air cleansing was calculated based on carbon. The price of one ton of carbon was taken to be US$10 (Dixon et al., 2000).
So the economic value of the forests of Iraf District by their carbon sequestration capacity was US$1.420 million in 2004 or 41 million rubles (at the exchange rate of 29 rub./US dollar).
Farm land
Farm land was valued using two criteria:
1) returns of household farms from cattle breeding;
2) land tax.
1) Valuation according to returns of household farms from cattle breeding.
Opening value of the stock
The following data were used in deriving the opening economic value (2004):
- average price of 83 rubles per 1 kg of meat108
- average prime cost of 58 rubles per 1 kg of meat109;
- Meat production is 3,770 t/year110. The annual return on livestock production is (83 – 58) x 3,770 = 94.25 mln. rub./year. The annual return on livestock production is taken to be constant over 100 years.
The discount factor is 31.6 at an annual rate of 3%.
The economic value of farm land by return on livestock production at household farms in Iraf District at the beginning of 2004 was around 3 billion rubles (2,978.3 mln. rubles)
Economic use
Sustainable use We used the annual return of household farms on livestock production to derive the value of farm land in economic use.
The economic user value of farm land in 2004 was 94.25 mln. rubles.
Depletion
There were no signs of depletion in 2004.
Closing value of the stock
The following data were used in deriving the opening economic value (2004):
- average price of 83 rubles per 1 kg of meat;
- average prime cost of 58 rubles per 2 kg of meat;
- meat production of 3,770 t/year.
The annual return on livestock production is (83 – 58) x 3,770 = 94.25 mln. rub./year.
The annual return on livestock production is taken to be constant over 100 years.
The discount factor is 31.6 at an annual rate of 3%.
The economic value of farm land by the return on livestock production at household farms in Iraf District at the end of 2004 was around 3 billion rubles (2978.3 mln. rubles)
2) Valuation by land tax.
Opening value of the stock
We used the following data in deriving the opening economic value of farm land:
- total tax revenue from use of farm land was 0.168 mln. rubles/year in 2004;
- total tax revenue is taken to be constant over 100 years;
- the discount factor is 31.6 at an annual rate of 3%.
The opening economic value of farm land was 5.3 mln. rubles.
Economic use
We used the amount of land tax paid to the local budget in 2004 for deriving the value of economic use of farm land.
The economic user value of farm land in 2004 was 0.168 mln. rubles.
Closing value of the stock
In deriving the closing economic value of farm land we used the following data:
- total tax revenue from use of farm land was 0.168 mln. rubles/year in 2004;
- total tax revenue is taken to be constant over 100 years;
- the discount factor is 31.6 at an annual rate of 3%.
The economic user value of farm land in 2004 was 5.3 mln. rubles.
The total economic value of farm land by return on livestock production at household farms of Iraf District and by the amount of land tax for 2004 was around 3 billion rubles. (2,978.3 mln. rub. + 5.3 mln. rub. = 2,983.6 mln. rub.).
The results of valuation of natural resources and ecosystem services in Iraf District in economic (monetary) terms are presented using the SEEA matrix (Table 3.13 – 3.15).
Table 3.13 Monetary value of non-produced economic assets of Iraf District of Republic of North Ossetia-Alania (renewable resources). Matrix

Table 3.14 Monetary value of non-produced economic assets of Iraf District of Republic of North Ossetia-Alania (non-renewable resources). Matrix
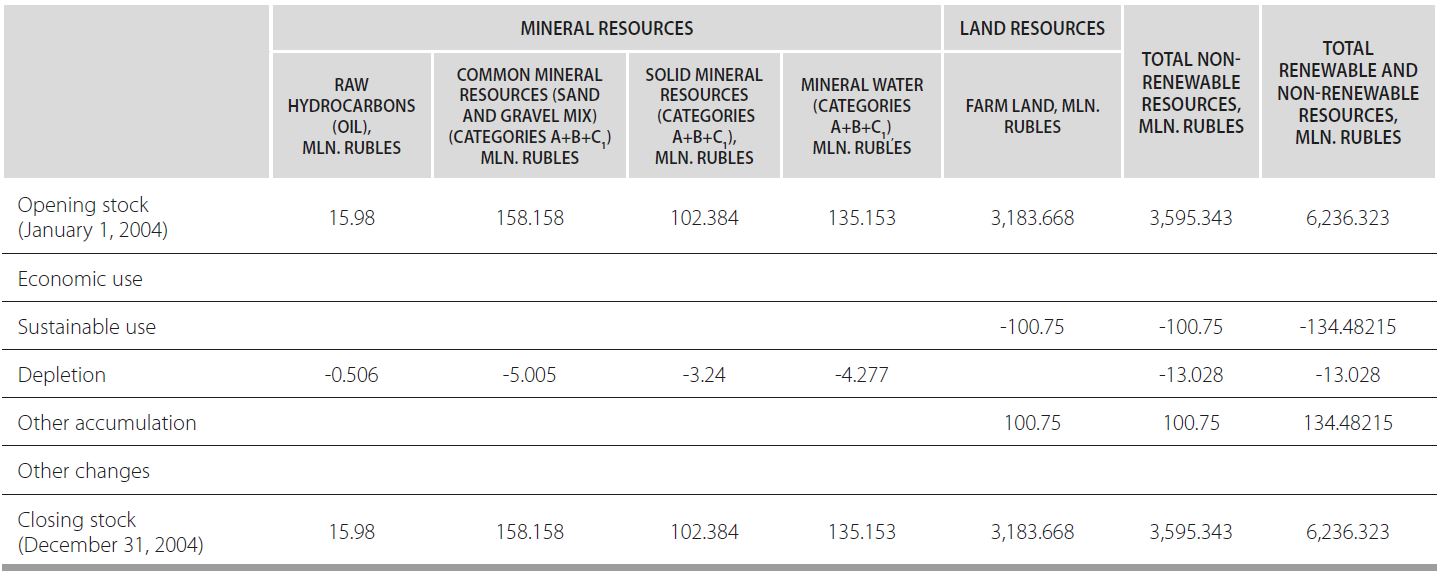
Table 3.15 Monetary value of non-produced economic assets of Iraf District of Republic of North Ossetia-Alana (renewable, non-renewable resources). Matrix

The results of these studies of how environmental-economic matrices (in physical and monetary terms) could be derived yielded various important conclusions and recommendations for creation of an information-analytical basis for environmental management and monitoring, and for improving the efficiency of resource use and environmental protection.
The economic value of the resources of Iraf District at the end of 2004 was 3,119.203 mln. rubles at a discount rate of 3%. The greatest value in the natural capital of the District was represented by farm land resources (cattle breeding in the household sector), amounting to 983.6 mln. rubles (95.7% of the total). The share of non-timber forest resources is quite significant (94.077 mln. rubles, 3%). The estimates for economic value of carbon sequestration by forests (41 mln. rubles, 1.3%) confirm the importance of forests for environmental protection. The economic value of water resources is fairly negligible (0.526 mln. rubles).
The high valuation of non-timber resources testifies to the high importance of the natural wealth of Iraf District, both for generating income and for possible future development of leisure and recreation. The high economic value of farm land used by households is notable in this respect as it could be used to supply catering needs in a future tourist industry. The high carbon sequestration capacity of local forests is promising from the point of view of implementation of the Kyoto Protocol (using Russia’s territory as a carbon sink), as well as for installation of new resort facilities in the District. The relatively low economic value of water resources points to the need to boost water-based economic activities, including hydropower generation (power supply for recreation facilities) and production of quality drinking mineral water for sale through retail outlets and markets. The absence of estimates for game husbandry and fishing resources highlights the need for their accounting by the District administration, in view of their importance for households and their potential depletion.
The existing Russian environmental accounting system is oriented to the needs of industry management. Using the available information for purposes of integrated territorial analysis is extremely difficult, so the system requires radical changes. Any intended transformations should be based on the methodology of environmental-economic accounting, focusing attention on the integrated evaluation of stocks and flows of natural resources in physical and economic (monetary) terms.
The pilot project in Iraf District for compiling basic matrices of integrated natural resource accounting using SEEA approaches showed the practical possibility and feasibility of their use for information-analytical support of territorial environmental management. The completion of such matrices, together with suitable monitoring, enables the timely identification of negative trends in a territory’s natural resources, so that resource depletion can be avoided.
Generally, the estimates derived in the SEEA matrices showed that the natural capital of Iraf District is used below capacity, as manifested in the understated values of mineral and water resources. Relatively high economic values are observed in sectors associated with household activities (private cattle breeding, non-timber products). As economic performance becomes more efficient, the proportion may change in favor of the public sector.
The completion of SEEA matrices revealed serious gaps in the availability of input information (absent and incomplete data) in certain spheres of natural resource use (non-timber forest resources, game and fishing resources, recreation) as well as inaccuracy (inconsistency) of the existing statistical and administrative accounting data.
The lack of proper exchange of information among different organizations in the environmental sector is of particular concern. The relationships in this sector are poorly formalized (absence of regulatory documents, etc.) and informal rules tend to dominate the aggregation and analysis of territorial data. As a result, management processes are characterized by high transaction costs, which need to be reduced in the future, when integrated accounting of natural resources is organized.
However, the research findings in Iraf District showed that even now it is possible:
1) to make comparative analysis of stocks and flows of use of economically significant natural resources;
2) to define measures for improving public supervision and control in environmental management;
3) to outline vectors to optimize integrated environmental management;
4) to identify threats of quantitative depletion of natural resources;
5) to determine the main areas for investment in environmental management.
In addition, the pilot testing of SEEA approaches in Iraf District helped to formulate some recommendations for improving integrated environmental management in the Republic of North Ossetia- Alania as a whole and in its administrative districts.
1. The comparatively low estimates of the economic value of natural capital show that the current structure of the Republic’s industry fails to provide sustainable, value-added use of its natural resources. It would be a mistake to draw up new management policies on the basis of these underestimated values. The results that have been obtained should be regarded as a starting point for examining various development scenarios for the natural wealth of the Republic. In this process, reasonable forecasts of when the Republic’s economic performance will reach the level of the most economically developed Russian regions should be used.
2. The results of testing of SEEA approaches in valuation of the natural capital of Iraf District and ways of its use should be included in the Republic’s decision-making processes.
3. Integrated analysis, together with monitoring, of the supply and use of the Republic’s natural capital and that of its administrative districts should be put in place in order to adjust current policies and enable efficient environmental supervision.
4. When working on specific investment projects (and investment policy as a whole), forecasts should be made of the natural capital of the Republic and of the administrative district, where the investments are planned, assuming increase (non-reduction) in the value of natural capital as a result of the projects.
5. In view of substantial man-made pressure on natural sites, it would be useful to supplement the SEEA matrices by estimates of environmental damage. So work on environmental-economic accounting of the natural resource potential of the Republic of North Ossetia-Alania involves:
a) revealing the trends and scale of qualitative depletion of resource potential due to economic activities and negative natural occurrences;
b) determining the scale of damage to main groups of natural resources and the respective addition to SEEA matrices;
c) evaluating natural capital of Republic of North Ossetia-Alania and Iraf District with respect to their recreation resources and farm land, so that these assets can be mobilized to support the most efficient sectors of the economy;
d) the development and implementation of specific measures to support economically effective and sustainable environmental management.
6. There should be a special focus on measures to be implemented in Iraf District.
First, in view of the significant economic value of natural resources in the household sector (meat production, non-timber resource consumption), support should be provided to support local household incomes, since poverty can force people to deplete the natural resources around them. Such measures should include assistance in production and sale of local produce, dissemination of knowledge and raising motivation for preserving natural resources that provide economic returns, and the establishment of reasonable economic regulation.
Second, the economic performance of Alania National Park as an entity, which serves to preserve territory biodiversity, should be improved. For that purpose, a feasibility study of Alania National Park should be prepared, containing an environmental-economic zoning of its territory. Infrastructure changes are needed in order to revive and modernize recreation services in the Digor Gorge. In particular, the cost of electric power need to be reduced (by construction of mini-hydropower stations), and the access road need to be improved.
Third, it would be expedient to speed up work on estimation of mineral reserves, use of which can boost the region’s economic development. This particularly concerns subsurface mineral water, extraction of which, in contrast with that of most other mineral resources, is not associated with substantial environmental damage.
Pervomaisky District is a remote area of Yaroslavl Region. Its area is 2,270 km2; it borders in the east on Lyubimsky District, in the south on Danilov District, in the west on Poshekhon District of Yaroslavl Region, and in the north and north-east on Vologda Region. The district contains 3 settlements: 1 urban-type settlement and 2 villages. As of January 1, 2009, the population was 12,014, of whom 4,894 were residents of the District center. The able-bodied population is employed in the forestry and wood-processing industry, services, farming, finance and banking, education, health care, etc.111
In the late 1990s, the Cadaster Institute used Pervomaisky District as a test site for the new model for evaluation of investments in relation to their impact on sustainability in territorial environmental management. We used SEEA methodology to evaluate the current and forecast state of natural capital under the pressure of external investments. The research differs from the pilot projects in Danilov and other municipal districts principally in its integrated approach to the investment analysis of natural resources, which included:
- revealing problems in the use of natural resources and environmental protection;
- evaluation of the stocks and flows of available natural assets (in physical and monetary terms in the framework of SEEA accounts) and analysis of findings from the point of view of possible resource depletion;
- determination and substantiation of potential vectors of environmental resource use and ecosystem services in the territory, based on the results obtained;
- establishing the best ways to invest in business development using the local natural resource base.
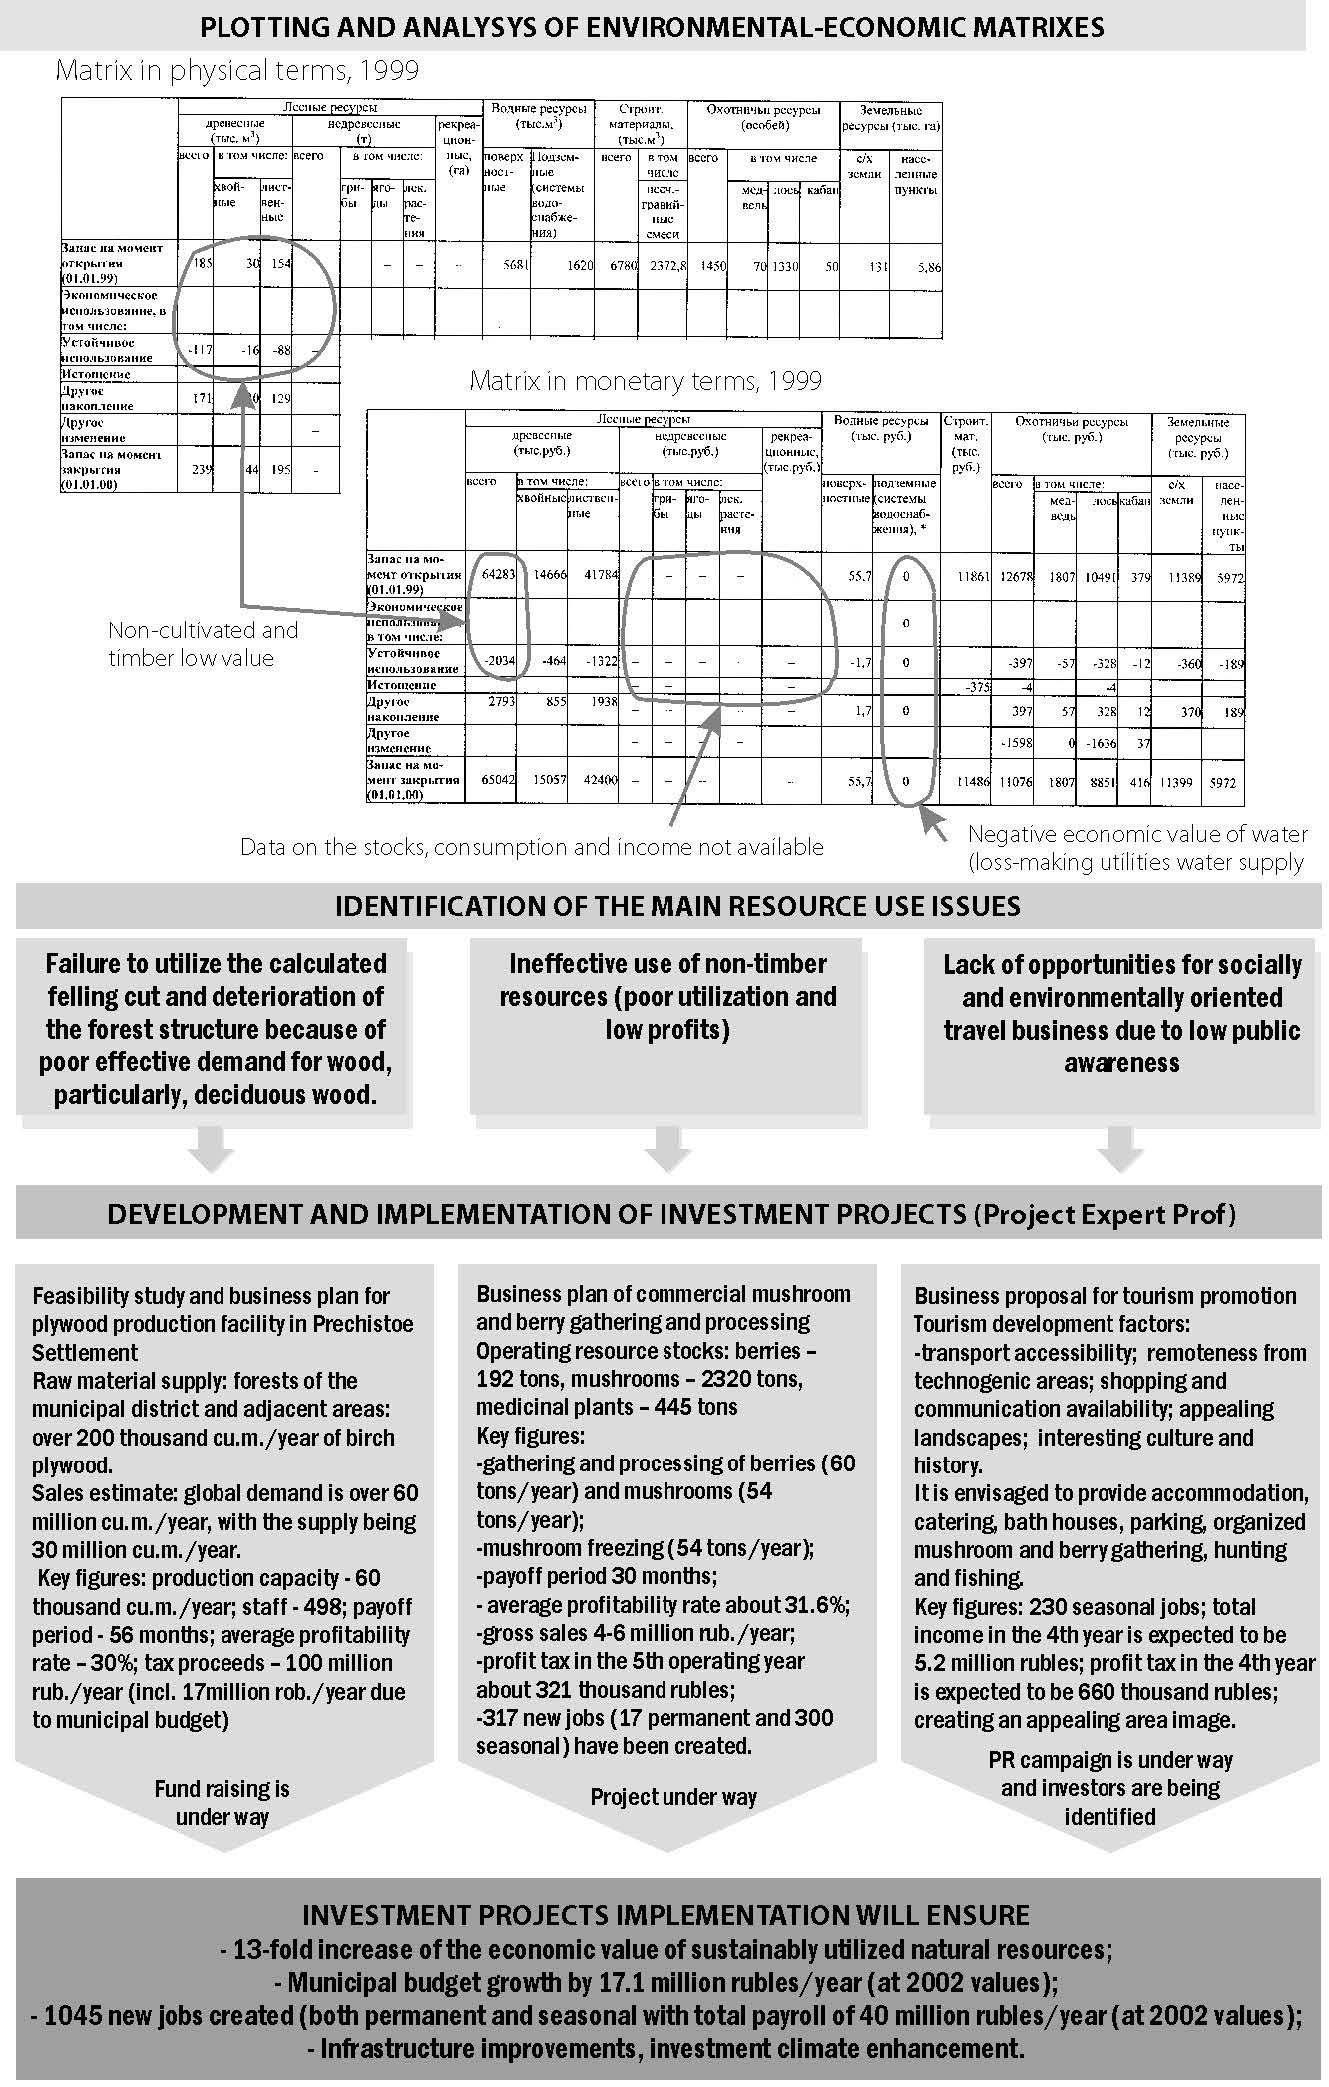
Fig. 3.20 Investment planning based on integrated environmental-economic accounting Pervomaisky District (Yaroslavl Region).
The work was carried out using monetary valuation of natural resources and ecosystem services (see Chapter 2 above) in existing social and economic conditions in the territory, taking account of information accessibility and validity and the possibility of obtaining additional data. Specific objects were selected for valuation based on analysis of existing problems in the environmental and socio-economic spheres and on the potential for using the valuation results to develop efficient mechanisms for environmental management and for boosting investments in local natural resources and ecosystem services.
Identification of priority environmental management tasks in the District. The most urgent problems in respect of natural resources and environmental protection were formulated in a series of workshops with administrative and professional leaders of the District. They were as follows:
1) misuse of forest areas;
2) ecological education of the general public;
3) water resource depletion and pollution;
4) compliance with environmental legislation.
The problems were specified with the assistance of professional consultants and then analyzed in order to reveal cause-and-effect relationships.
Preparation of current SEEA accounts. By using statistical and departmental data as well as expert opinions derived from interviews with resource managers112 , CEOs of enterprises using natural resources and the general public, economic estimates were derived for water resources (water in the system of water supply to households), timber resources (timber and non-timber products) and recreation facilities. The data obtained were used to compile “white” and “gray” SEEA matrices, which indicated the most economically efficient types of environmental management from the standpoint of sustainable development of the District (Table 3.16 – 3.19). It was concluded that no socially or environmentally dangerous depletion of natural resources was occurring in the district under the existing mode of environmental management.
Table 3.16 “White” matrix for physical accounting of natural resources, 1999
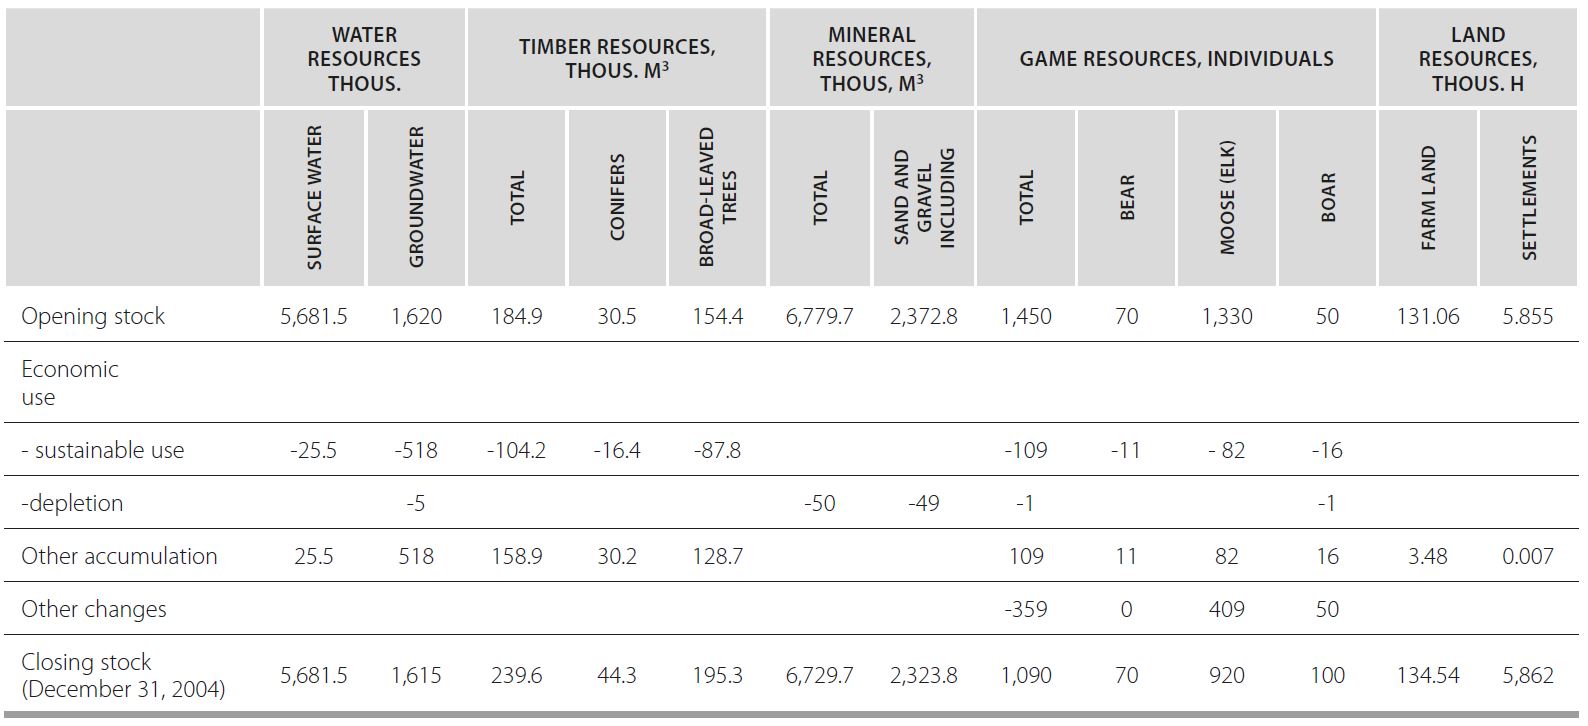
Table 3.17 “Gray” matrix for physical accounting of natural resources, 1999113
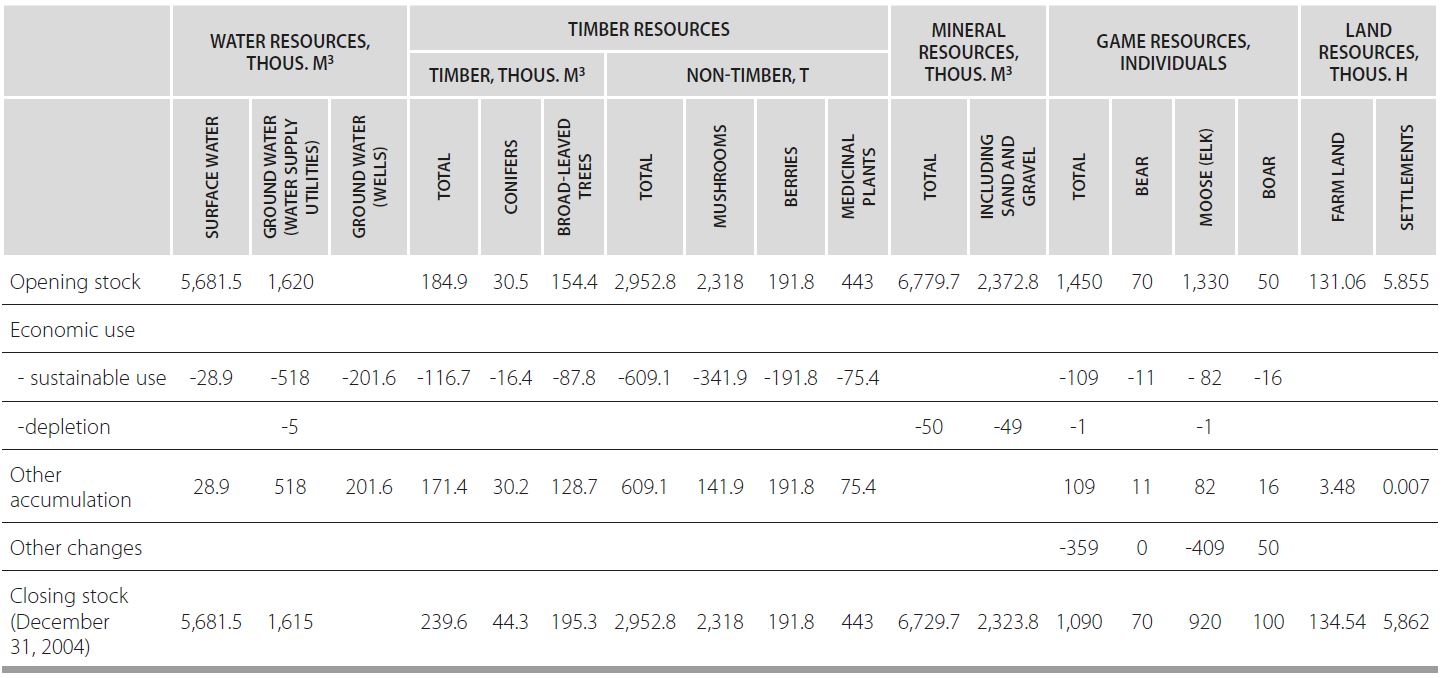
Table 3.18 “White” matrix for monetary accounting of natural resources, 1999
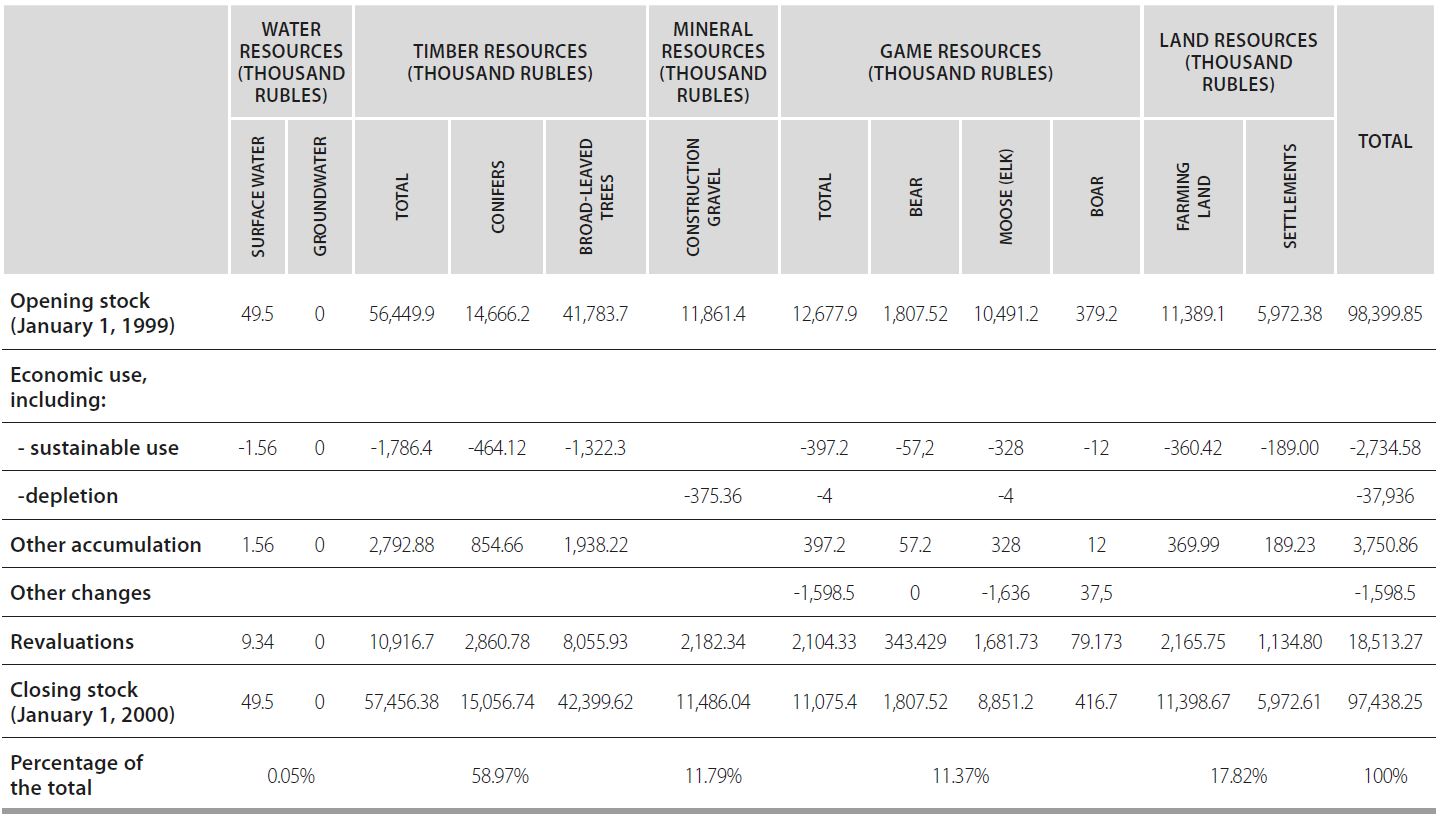
Table 3.19 “Gray” matrix for monetary accounting of natural resources, 1999
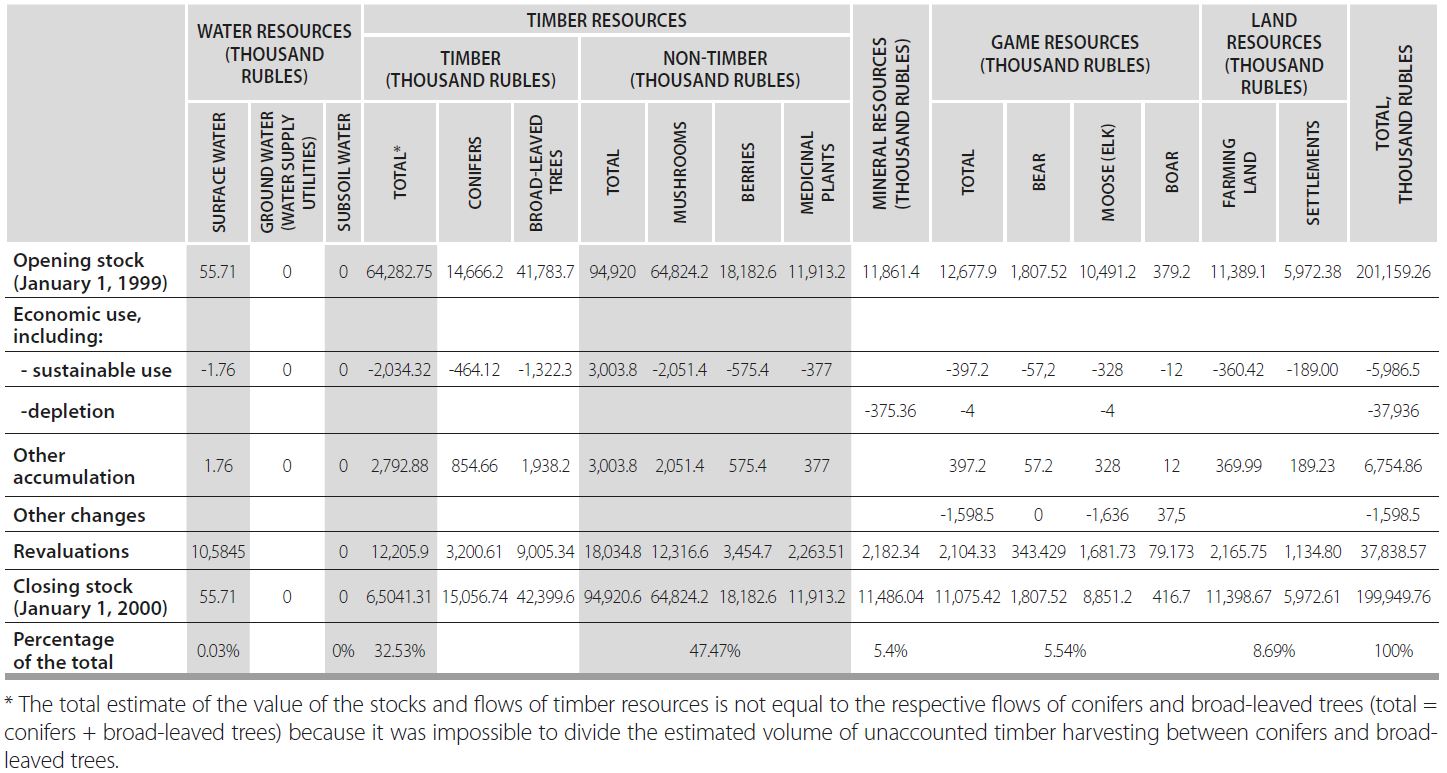
Source: Cadaster Institute, 2003.
We used the data entered into these matrices to identify the best prospects for development of business using the local resource base. The most promising spheres were plywood production, rural tourism, commercial procurement and processing of wild plants (non-timber forest products). Relevant investment feasibility studies were completed with detailed substantiation of the most efficient types of business.
Plywood production
Average forest cover in Yaroslavl Region is 47% with predominance of broad-leaved trees. Birch trees cover 363,000 h (42.7%) and conifers occupy 332,000 h (38.9%). The felling rate in Yaroslavl Region has been calculated at 2.619 m3, of which 542,000 m3 is commercial soft-wood broad-leaved timber. This is mainly birch (335,000 m3), which is the main raw material for plywood. The volume of official timber harvesting fell by three times in 1990-1995 and was only 25% of the standard felling rate. The failure to carry out standard felling underlines the need for efficient wood processing, particularly of broad-leaved species. This issue is of great importance for north-eastern areas of Yaroslavl Region, where Pervomaisky District is located.
Drawing on data in the “gray” SEEA matrix, it can be concluded that 80% of the total value of natural capital in Pervomaisky District consists of forest resources (32% of the value represents timber forest resources and 48%, represents non-timber forest resources). There are no signs of timber resource depletion (there are considerable reserves for use of forest resources). Added-value wood processing will boost local budget revenue, create new jobs and reduce the share of illegal use of resources (reflected in the gray matrix).
The feasibility of value-added wood processing is confirmed by the fact that timber exports from Yaroslavl Region as a whole amount to 165,700 m3, with estimated value of US$5.618 mln., of which 70% by volume is raw timber (roundwood) with value of US$1.866 mln. So the largest share of total value of timber export is represented by the remaining 30%, which is value-added processed wood.
According to available data, the average price of 1 m2 of processed wood is 4.7 times higher than round wood. So efficient use of timber resources can only be achieved by increasing the share of wood, which is processed. The main types of value-added wood processing, in Russia and worldwide, are production of paper, large-sized plywood, sawn wood, laminated planks and boards, and chip board.
Demand for these processed materials and the capacities of Pervomaisky District to supply timber inputs should be compared in order to determine the most profitable type of production.
Table 3.20 Aggregated assessment of timber industry operations relevant to Pervomaisky District

So the most profitable use of timber resources in Pervomaisky District appears to be the production of large-size plywood. The availability of suitable raw materials is the main argument in favor of plywood production. The forests of Pervomaisky District are 74% broad-leaved (predominantly birch), and forest structure in neighboring areas is similar. Only 50% of the sta$3ndard felling rate for broad-leaved species is actually used. The best location for large-size plywood production would be the administrative center of Pervomaisky District (the settlement of Prechistoye). Prechistoye is traversed by the Moscow-Kholmogory highway and by the railway line from Moscow to Vologda. The settlement is equidistant from potential raw material suppliers (regional logging operators are situated in a radius of about 100 km), and its labor force is suitably qualified.
The proposal is to set up a highly profitable enterprise for the production of water resistant large-size plywood, which is used in construction of residential buildings, cultural and social facilities.
A construction feasibility study and business plan were prepared and agreed with the State Environmental Committee of Yaroslavl Region (Order issued on December 17, 1997, No. 663) and the State Independent Expert Group (Decision No.16/105-1-97 of December 8, 1997) (Table 3.21).
Table 3.21 Construction feasibility study and business plan for creation of an enterprise to produce waterproof large-size plywood.
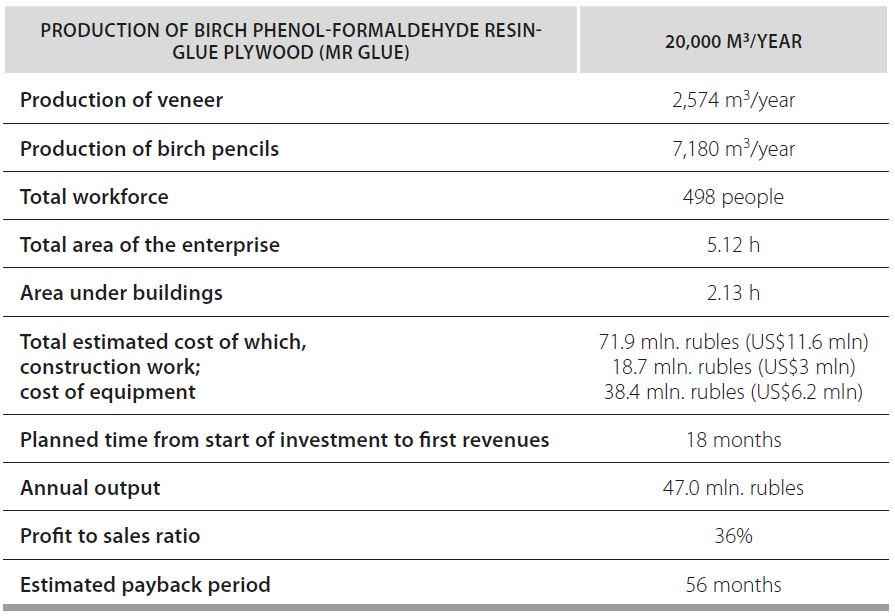
Product market The equipment and technology to be used will guarantee high quality of the products. The large size of the plywood and its water resistance will offer access to markets in Western Europe and the Middle East as well as CIS markets. Potential consumers are in the furniture manufacturing, shipbuilding, car and rolling stock construction industries, agricultural engineering, construction, etc. Regional sales structure: Yaroslavl Region – 10%, Russian regions – 20%, CIS – 10%, other export – 60%. There is no comparable manufacture in Yaroslavl Region
Investment requirements Required investment is 65.6 mln. rubles (US$10.59 mln.) The investment payback period is 5.3 years. Construction of a plywood factory is included in the state investment plan for Yaroslavl Region. The project envisages eventual increase of plywood output to 60,000 m3/year, which will substantially enhance technical and economic performance of the enterprise. There are sufficient raw material and workforce reserves in case of production expansion.
The plywood production enterprise will substantially increase tax revenues of regional and local budgets. Local budget revenue will be increased by the following taxes on the enterprise:
— 2% taxable profit (about 8 mln. rubles);
— 7% income tax (about 3 mln. rubles);
— 50% corporate property tax (about 6 mln. rubles).
So total budget income of Pervomaisky District will be about 17 mln. rubles (at 2002 prices) when the taxable profits are fully established. In addition to budget revenues, the project will create 500 new jobs in the District and help to develop infrastructure. The value-added processing of timber offered by the plywood manufacture will increase economic value of timber resources in the District to 1,196.2 mln. rubles, which is over 20 times more than before its creation.
Development of rural tourism
The environmental-economic studies showed considerable under-utilization of the recreation potential of Pervomaisky District. Town residents incur high costs to maintain and protect their summer houses (their own recreation facilities), particularly in winter. The tendency of urban residents to give up their own private summer houses entails growing interest in affordable “as-and-when” holiday facilities outside town. Rural areas of Pervomaisky District are regarded by many residents of cities and towns of Yaroslavl and neighboring regions as an attractive leisure destination.
It is important to take account of all the needs of potential holidaymakers: transport accessibility; friendly reception; affordable rental rates (in rooms or houses), parking, catering, etc. However, the scale and quality of service in rural areas in Russia is bound to be limited. Limitations may be inherent (e.g., availability of water bodies for fishing, ski slopes, hunting quotas, etc.) or may be due to insufficient infrastructure (lack of access roads, lack of accommodation, etc.), All these factors have to be carefully examined in order to avoid negative impact on the environment and maintain the general appeal of the territory.
According to our studies, the territories of Pervomaisky District have a range of infrastructure elements suitable for rural recreation, including transport accessibility, retail outlets, well-equipped catering facilities and pharmacies. The combination of key environmental and social conditions (proximity of forests, rich hunting areas, clean rivers and streams with their picturesque environs, remoteness from urban “hustle and bustle”) together make the District an attractive destination for holidaymakers from neighboring cities and towns. The District has 58 historical and cultural monuments and 31 unique natural sites. The most significant cultural monuments are churches, such as Holy Trinity Church in Nikolskoye village (1886-1896), St Nicholas Church (1801) in Novaya Gora village, the Church of the Annunciation (1796) in Trofimovskoye village, the Assumption Church (1801) in
Prechistoye settlement, and the Cathedral of the Savior, with unique architectural design, in Kukoboy village (1909-1912); natural monuments include the Isakovskoye and Turibarovskoye marshes, and Sosnovy Park in Kukoboy village.
Fig. 3.21 shows existing tourism infrastructure in Pervomaisky District. In the course of the studies local residents were interviewed in order to gauge their interest in the development of tourism. The results indicate that local people are interested in providing accommodation and catering services to holiday visitors.
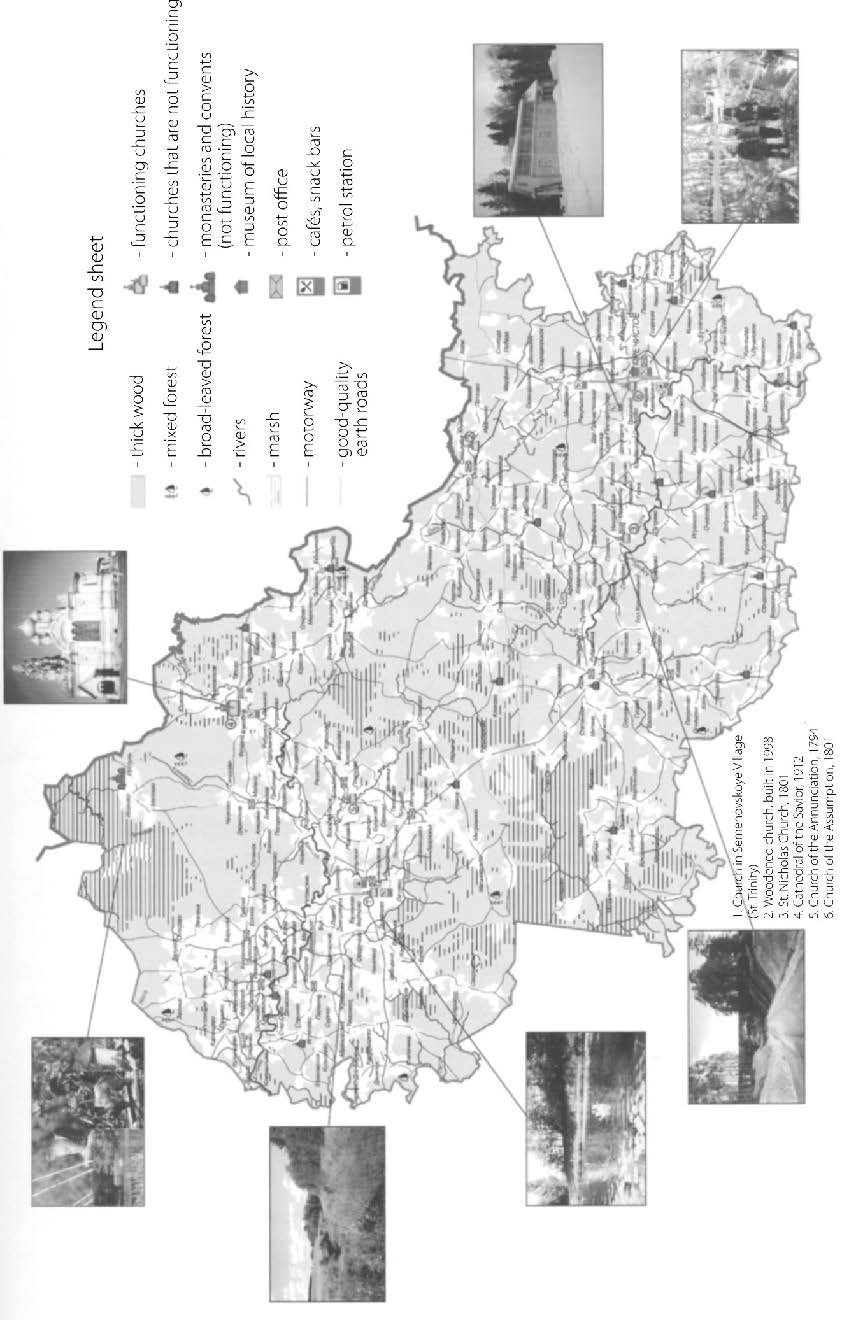
Fig. 3.21 Recreation facilities and conditions in Pervomaisky District %.
In order to implement the rural tourism project, a data base should be prepared, which gathers, summarizes and analyzes information on supply and demand of the respective services. A travel agency, working on a contractual basis, could act as an intermediary between the hospitality providers and holidaymakers.
Based on the findings of the field studies in Pervomaisky District, the following data were used for calculations:
- 180 households out of 748 respondents were interested in the proposed project;
- actual involvement of each household in service provision is expected to be 60 days per year;
- gross income per household for a standard package of services is envisaged at 535 rub./day.
The calculations, made using Project Expert software, showed that total annual income earned by all households in the fourth year of project implementation would be 5.12 mln. rubles. At the current income tax rate, the total amount of taxes paid annually to the budget by all households would grow steadily and reach 667,700 rubles by the fourth year of project implementation.
The rural tourism business proposal includes creation of infrastructure, which will make Pervomaisky District more attractive to visitors. The development of rural tourism in the District will create jobs for the local population and improve their living standards. It will have favorable impact on the innovative and investment appeal of the territory.
Commercial procurement and processing of wild plants
Forest resources are a major resource in Central Russia. The integrated management of diverse renewable forest resources is organized to meet the interests of the general public to the fullest possible extent. Harmonious and coordinated use of all resources without detriment to their productivity is the basis of successful forest management. It is therefore important that economic activity should not be focused exclusively on timber resources, but also extends to various non-timber resources, such as wild-growing berries, fungi (mushrooms) and medicinal plants, which have higher economic value than timber resources (as confirmed by international and Russian research findings).
The favorable natural environment and extensive forest areas of Pervomaisky District contain numerous species of plants and berries, medicinal herbs and edible mushrooms which, if properly harvested, processed, stored and exported from the district, could be an important factor in its economic development. Pervomaisky District has substantial reserves of berries, medicinal plants, and extensive mushrooming areas (Table 3.22 – 3.24).
Table 3.22 Stock of wild-growing berries in Pervomaisky District (freshly harvested raw material)
|
Type of plant |
Quantity of shrubs* |
Total shrub area, h |
Commercial stock of raw materials, t |
Volume of potential annual harvesting, t* |
|
Red cowberry |
12 |
1,667 |
18.5 |
18.5 |
|
Blueberry |
26 |
1,112 |
27.3 |
27.3 |
|
Swamp blueberry |
11 |
4,779 |
14.0 |
14.0 |
|
Cranberry |
15 |
5,062 |
132.0 |
132.0 |
|
Total |
64 |
13,620 |
191.8 |
191.8 |
* In low-yield years the berry stock will be three times lower, while high yield years will provide amounts that are 2-2.5 times greater.
Table 3.23 Summary list of mushrooming areas and commercial reserves of mushrooms in Pervomaisky District
|
Forestry, forest farm |
Area of mushroom sites, h |
Commercial reserves of mushrooms at different harvest levels, t |
Annual average commercial reserves, t |
||
|
low |
medium |
high |
|||
|
Prechistensky forest |
|||||
|
Pervomaisky forest |
6,121 |
50 |
173 |
329 |
156 |
|
Skalino forest |
8,033 |
66 |
227 |
431 |
205 |
|
Voskresensk forest |
3,825 |
31 |
108 |
205 |
98 |
|
Kozsky forest |
10,711 |
88 |
303 |
575 |
274 |
|
Marfino forest |
4,208 |
34 |
119 |
226 |
107 |
|
Makarovsky forest |
5,356 |
44 |
151 |
288 |
137 |
|
Total |
38,254 |
313 |
1,081 |
2,054 |
977 |
|
Pervomaisky extended forest |
37,796 |
282 |
967 |
1,836 |
883 |
|
Prechistensky extended forest |
15,769 |
145 |
499 |
951 |
458 |
|
Total for the District: |
91,819 |
740 |
2,547 |
4,841 |
2,318 |
Table 3.24 Stock of medicinal raw materials in Pervomaisky District (air-dried raw materials)
|
Type of plant |
Type of raw material |
Quantity of shrubs* |
Total shrub area, h |
Commercial stock of raw materials, t |
Volume of potential annual harvesting, t* |
|
Marsh rosemary |
sprouts |
23 |
7,075 |
154.9 |
17.2 |
|
Red cowberry |
leaves |
14 |
1,079 |
75.4 |
10.8 |
|
Drooping and downy birch |
buds |
- |
1,190 |
2.2 |
2.2 |
|
Bean trifoil |
leaves |
17 |
1,146 |
29.0 |
7.3 |
|
Arrow-wood |
fruits |
12 |
380 |
1.4 |
0.7 |
|
Lilly-of-the-valley |
grass |
11 |
4,040 |
3.4 |
0.6 |
|
Raspberry |
fruits |
26 |
320 |
5.8 |
2.9 |
|
Mountain ash** |
fruits |
12 |
383 |
3.0 |
1.5 |
|
Common pine |
buds |
- |
118 |
0.2 |
0.2 |
|
Chaga mushroom |
fruit body |
15 |
1,694 |
8.2 |
8.2* |
|
Blueberry |
sprouts with leaves |
36 |
1,629 |
156.8 |
22.4 |
|
Cinnamon rose |
fruits |
5 |
169 |
2.7 |
1.4 |
|
Total |
171 |
19,223 |
443. 0 |
75.4 |
* The figure for possible annual harvesting includes the total available stock of chaga in the District;
** The stock of mountain ash fruits is understated as this plant hardly ever forms dense shrubs that meet the standards of commercial harvesting.
The environmental-economic estimates derived in the SEEA framework for the stock of non-timber resources show no depletion at the current extraction rate, and all of the above products could be harvested more intensively.
It is important to note that the non-timber resource market has yet to be fully developed. This market is still in an early stage of development in Pervomaisky District. However, the analysis shows that the non-timber products mentioned above certainly have potential as exports from the District, since they are much in demand among Russian and foreign producers and consumers.
The study of the stock of non-timber resources, their location in Pervomaisky District, general market analysis and possible processing methods pointed to several options for business development in this area, as well as potential advantages and disadvantages (Table 3.25).
Table 3.25 Options for processing of non-timber forest resources (wild berries and mushrooms) in Pervomaisky District, advantages and disadvantages
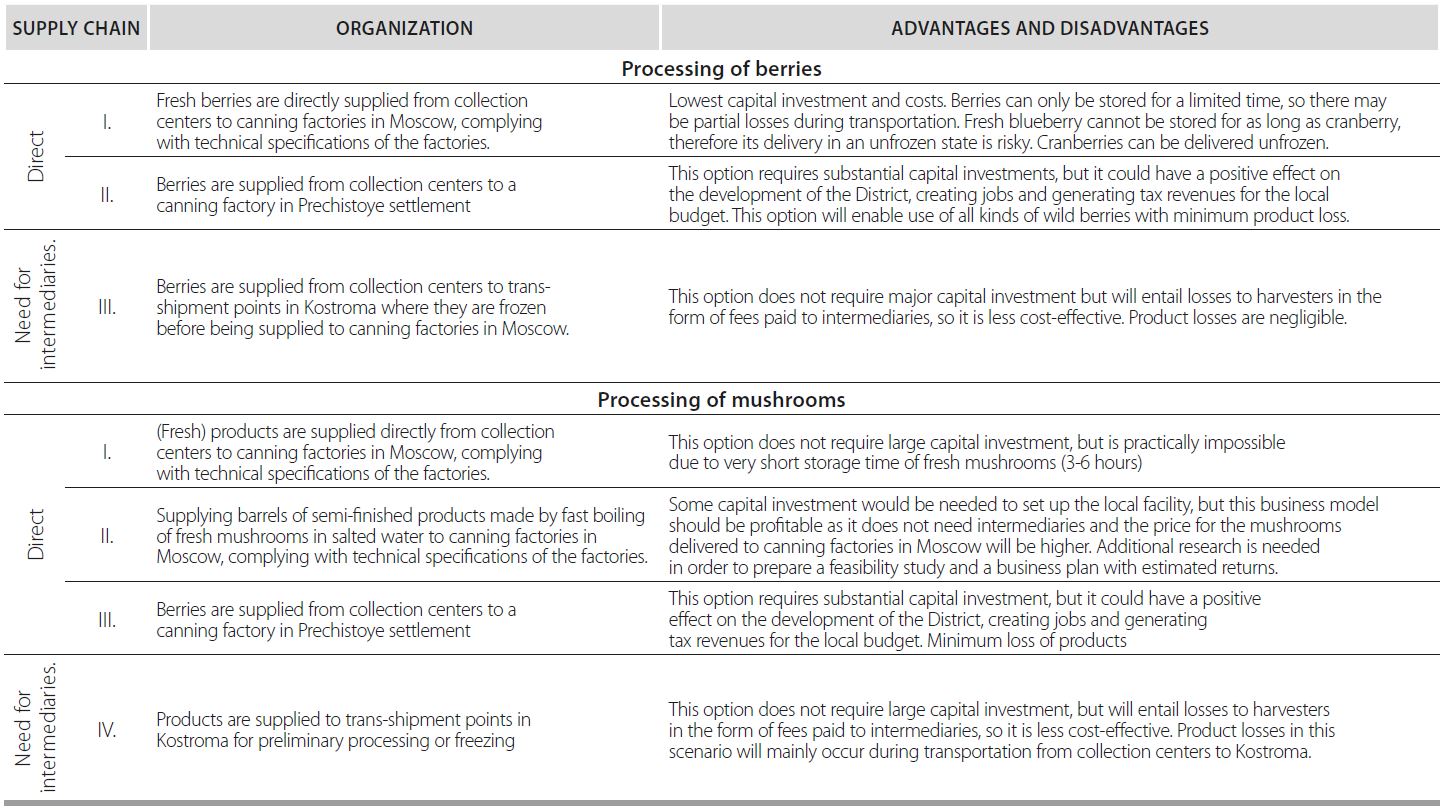
Whichever variant is chosen for non-timber resource processing, it will be necessary to set up a process that includes:
- the establishment of collection centers for mushrooms and berries; several factors must be taken into account when creating such centers (available resources, transport accessibility, demographics);
- terms and conditions for accepting products from harvesters (purchase price, product parameters, time frame for product purchasing, etc.), public notices of purchase;
- creation of facilities for product grading, freezing, packaging and storage; the facilities must comply with statutory requirements (technical, economic, sanitary, etc.);
- transportation of packaged products by special vehicles for further distribution.
Cost analysis of commercial harvesting of mushrooms and berries (picking, freezing and distribution) was carried out. The project is rated at the following estimated harvesting volumes: mushrooms – 54,000 kg; berries – 60,000 kg (see Table 3.26)
Table 3.26 Product supply pattern
|
Products |
July |
August |
September |
October |
|
Frozen mushrooms |
15,133 kg |
15,133 kg |
15,133 kg |
8,600 kg |
|
Fresh berries |
30,000 kg |
30,000 kg |
–– |
–– |
Assuming capacity use of frozen mushroom storage (up to 9,000 kg) and the supply rate specified above (Table 3.25) at current selling prices (berries at 30 rub./kg, frozen mushrooms at 70 rub./kg), the main project parameters would be as follows:
- payback period (from start of project financing) – 19 months;
- internal rate of return around 74%;
- gross sales of 4.6 mln. rub./year;
- corporate profit tax of 320,000 rubles by the 5th operating year;
- upfront investments of 3.5 mln. rubles.
The project for commercial harvesting of mushrooms and berries will boost tax revenues to budgets at different levels. Local budget revenue will grow thanks to the following taxes:
- 2% taxable profit – about 6400 rubles;
- 75% income tax – about 200,000 rubles;
- 50% corporate property tax – about 20,000 rubles.
Total revenue to the budget of Pervomaisky District will be about 226,000 rub/year at 2002 prices.
Overall, the research shows that Pervomaisky District has substantial reserves of non-timber forest resources, which could be used for commercial harvesting and processing of wild berries and mushrooms. Implementation of the project will create 317 jobs (17 full-time and 300 seasonal), mitigating employment problems in the area and boosting tax revenues of the local budget.
The examples of various projects carried out by the Cadaster Institute show how estimates of the economic value and social significance of environmental resources and ecosystem services in various territories were obtained.
Such integrated systematic estimates have enabled a new vision of regional development. They have provided important information and analytical materials to local government, which can help to address specific issues of municipal governance and environmental management and, in a broader sense, improve the strategic planning of territorial development.
DEVELOPING INFORMATION SYSTEMS FOR RESOURCE USE AND ENVIRONMENTAL PROTECTION USING THE SEEA FRAMEWORK
According to the usual definition, the green economy is an economy that improves human well-being and social equity, while significantly reducing environmental risks and ecological scarcities (UNEP, 2011a). It involves major changes in our ways of producing and consuming things, accompanied by shifts and reforms in institutional systems, which can foster economic growth and development while ensuring that natural assets continue to provide the resources and environmental services that guarantee human well-being. The position of the OECD in respect of the upcoming changes is clear114 : the “green” economy not only focuses on “green” sectors, its purpose is “making all innovation green, making sure that green considerations are incorporated into the innovation policy settings at the outset in order to make mobility smarter, to make buildings and construction less resource-intensive and less polluting.”115
Strategies to promote “green” growth must encourage investment and innovation that sustain growth and give rise to new economic opportunities (OECD, 2011a). Such strategies should be based on deep understanding of the determinants of green growth and of related trade-offs and synergies. These should be supported by relevant information on the results obtained and the targets to be achieved. Indicators are therefore required that can help to raise awareness among leaders and society as a whole. The indicators must be integrated in a conceptual framework that defines criteria clearly and is based on internationally consistent data.116
The OECD green growth strategy combines economic, environmental, social and technological aspects of development as well as international assistance in a common framework for the purposes of development. A set of indicators is used that charts progress made on the road to green growth. The conceptual methodology of measurements set out by the OECD (2011a) integrates the main characteristics of green growth with basic principles of accounting and the “pressure – state – response” (PSR) model used in environmental reporting and estimates. The focus of attention is on such economic functions as production and consumption, and interaction between the economy, the natural asset base and policy actions (Fig. 4.1). The ultimate goal of the measurement methodology is to provide well-structured analysis of the sources of green growth and to derive indicators that are relevant for decision-makers and the general public. For these purposes a specific action plan has been defined in respect of measurements and future vectors have been set out for developing sets of estimates and resolving other measurement issues (OECD, 2014).

Fig 4.1 Measurement methodology concept %.
Source: OECD, 2011.
Indicators In the framework of the green growth strategy, the OECD has defined a list of around 25 indicators classified into four main groups and complemented with generic indicators describing the socio-economic context (Table 4.1).
Table 4.1 Groups of green growth indicators and their themes
|
1 |
The environmental and resource productivity of the economy |
* Carbon and energy productivity * Resource productivity: materials, nutrients, water * Multifactor productivity |
|
2 |
Natural asset base |
* Renewable stocks: freshwater, forest, fish resources * Non-renewable stocks: mineral resources * Biodiversity and ecosystems |
|
3 |
The environmental dimension of the quality of life |
* Environmental health and risks * Environmental services and amenities |
|
4 |
Economic opportunities and policy responses |
* Technology and innovation * Environmental goods and services * International financial flows * Prices and transfers * Training and skills development * Regulations and management approaches |
|
5 |
The socio-economic context and characteristics of growth |
* Economic growth and economy structure * Productivity and trade * Labor market and income * Socio-demographic patterns |
Source: OECD, 2011.
The natural starting point for defining a system of indicators according to the adopted methodology is the sphere of production. The indicators of environmental and resource productivity help to determine whether and to what extent economic activities (both production and consumption) are becoming more “green.”
However, raising productivity is not sufficient. It is often necessary to reduce pressure on the environment in order to protect the economy against future negative impacts. This is the reason for introducing the second group of indicators, which deal with monitoring of the natural asset base and its preservation within the sustainable threshold of impacts.
The third group of indicators, dealing with the environmental quality of life, reflects direct and indirect interaction between humans and the environment. Finally, greening of the economy also creates opportunities for growth and employment.
The fourth group of indicators shows both the economic opportunities for green growth and policy measures that create them.117
The list of green growth indicators is neither exhaustive nor final, because some of the proposed indicators are not fully measurable at the present time. As the discussion evolves, new and improved data may appear which will require modification of the list of indicators; about 20 of the indicators listed are measurable with various degrees of precision. The indicators are constantly updated and published.
The focus in design of the green growth indicators is on the following aspects:
1) Balanced coverage of the two dimensions of green growth, i.e., “green” and “growth,” and of their main elements; particular attention is given to indicators that reflect interaction of the two dimensions;
2) the monitoring of key issues that are significant for the indicators and that are common to OECD countries and partner countries. Each of the indicators is selected with due account for its policy relevance, analytical soundness and measurability (Table 4.2).
Table 4.2 Key principles in selecting green economy indicators
|
Policy relevance |
The indicators should have clear policy relevance, in particular they should: * provide balanced coverage of the key features of green growth with a focus on those that are of common interest to OECD member and partner countries * be easy to interpret and transparent, i.e. users should be able to assess the significance of the indicator values and their changes over time * provide a basis for comparisons between countries * be adaptable to different national contexts and analyzable at different levels of detail or aggregation. |
|
Analytical soundness |
The indicators should be analytically sound and benefit from a consensus as to their validity. They should be linkable to economic and environmental modeling and forecasting. |
|
Measurability |
The indicators should be based on data that are available or that can be made available at a reasonable cost, and that are of known quality and regularly updated. |
Source: OECD, 2011c.
Shared orientation to the principles of sustainable development of the SEEA, on the one hand, and conceptual approaches to measurements during progress to green growth, on the other hand, presupposes that, despite any differences between these two information systems as to their goal orientation, scope of problems solved, formats used, etc., there is a broad field of interrelations between them. The conceptual platforms of the OECD Strategy of Green Growth and the SEEA Central Framework are similar, firstly, in their orientation to integrating the economic sphere with respective environmental issues, as stated at the Joint OECD/UNECE Seminar on SEEA implementation (October 14-15, 2015, Geneva, Switzerland). It has also been established that the SEEA provides an important platform for research and statistical analysis related to the OECD Strategy of Green Growth. It is no accident that, since publication of the international indicators of green growth by the OECD in 2011, a number of countries have implemented the existing environmental-economic accounts and other sources of environmental statistics at national level. The results of the respective studies have been published in many countries (Germany, Korea, Mexico, the Netherlands and the Czech Republic); and work is in progress in Guatemala, Columbia, Costa Rica, Kyrgyzstan, Paraguay and Peru (supported by UNIDO and the Development Bank of Latin America (CAF)), as well as in Ecuador. Other countries are strongly recommended to join this initiative in order to expand the information base for the indicators118.
The SEEA has great potential for successful implementation of OECD green growth approaches thanks to its systematic character and ability to reflect and understand environmental-economic linkages as interrelationships within an open non-equilibrium system, whose development cannot be precisely predetermined, but is of a multivariate nature. The SEEA methodology is of great importance for measuring and analyzing the green economy indicators thanks to its focus on integrated value estimates of natural capital and its elements (relying on expert data in some cases) and ability to determine threshold values of man-made impact on the environment. So it materially expands potential for measuring environmental characteristics, the effects of pressure on the environment and various changes resulting from such pressure, as well as emerging hazards and ecological risks.
The SEEA Central Framework enables calculation of many indicators of the green economy. Some indicators are directly integrated in specific accounts in the form of aggregates (e.g., for the economy as a whole, balancing items), others can be calculated as ratios between variables from different environmental-economic accounts or by comparing data from the SEEA accounts with data from national accounts. In certain cases, indicators can only be derived by using analytical tools that are described in software applications and additions to the SEEA.
At present, the data used for compiling information systems in environmental-economic relationships are obtained from various statistical sources (systems of environmental monitoring, emission cadasters, registers of substance emissions and transfers, establishment surveys. national accounts, foreign trade statistics, etc.) These sources are also used for compiling SEEA accounts. In addition, they can be used directly for estimating certain indicators of green growth. Their adaptation to the SEEA definitions and classifications will help improve the alignment of different data sets and hence their reliability.
The use of common concepts, definitions and classifications is a guarantee of SEEA applicability to indicators of the green growth strategy, because monetary and physical estimates can be easily combined in the agreed format, e.g., for measuring correlations between intensity and productivity. The macro-level indicators lend themselves to breakup into economic sectors and industries, which helps to trace structural changes over time, analyze pressure of different industries on the environment and separate government response from measures undertaken by the business community or individual households. This is particularly important for determining the efficiency and economic efficacy of development strategies. The use of SEEA methodology is most valuable for measuring green economy indicators, which are used for monitoring the environmental and resource productivity of the economy, its environmental assets, environmental activities and instruments, and their role in the economy.
Indicators for monitoring environmental and resource productivity of the economy Changes in environmental productivity and resource productivity can be monitored with the help of a number of indicators which integrate natural and physical data or present them concurrently. They correlate the use of environmental services in production and consumption with the outputs obtained and help to distinguish between trends in production and consumption, and use of the relevant environmental services. Depending on the type of environmental service, one can distinguish between indicators of environmental productivity and (natural) resource use efficiency.
The environmental productivity indicators show the efficacy of measures for reduction, control and prevention of emission of pollutants and other substances generated in the processes of production and consumption. They are usually expressed in the form of correlations of intensity or productivity. These indicators correlate environmental variables, such as emissions of pollutants and other substances, with economic variables such as output, income and value added. The indicators of environmental productivity can be disaggregated by sector and industry or by emission source.
The indicators of environmental productivity characterize the environmental and economic efficiency of the use of natural resources, including water, energy, and other materials, in production and consumption. Generally, they are expressed in terms of relative intensity or productivity, correlating environmental variables, such as extraction, production or consumption of natural resources and materials with such economic variables as output, income and value added.
As mentioned above, productivity indicators are usually expressed as intensity or productivity ratios. Intensity indicators are calculated as the relation of the environmental service used or environmental pressure imposed to the economic value added (or the amount of final product), while productivity ratios are calculated as the inverse relation. Productivity indicators refer to CO2 emissions and to the use of energy, non-energy materials and water. All relevant environmental data can be derived from the tables defined in the SEEA Central Framework: air emissions account (Table 3.7); supply and use tables for energy resources in physical terms (Table 3.5); economy-wide material flow accounts (Section 3.6.6); and supply and use table for water resources in physical terms (Table 3.6).
Indicators used to monitor natural assets and their role in the economy Natural assets comprise a part of natural capital and provide raw materials, energy carriers, water resources, air, land and soil. They support the provision of environmental and social services. Natural assets and their role in the economy can be monitored by analyzing stocks of natural assets together with the flows of environmental services, which they provide, or through indicators reflecting the use of assets and the extent to which the quality, quantity or value of the asset base is preserved. Environmental assets should be described in both physical and monetary terms; a large amount of useful information about stocks and changes in environmental assets can be derived from the SEEA asset accounts, which are compiled in physical and monetary terms.
It should also be mentioned that, if the indicators merely state the level and changes in the stock of resources, such information does not help to understand whether natural resources are being used in a sustainable way or whether there are risks to future economic growth from non-sustainable use or management of resources. When analyzing depletion of natural resources, it is important to know the dynamic of indicators in physical terms. Comparing resource consumption rates with respective stocks, we can determine whether (or to what extent) the extraction rate exceeds the regeneration rate of renewable resources and assess the remaining service life of non-renewable resources.
Asset accounts in monetary terms can be used to derive indicators for individual assets and for combinations of assets. Availability of a common measurable parameter simplifies the task of aggregating data from different financial asset accounts. It then becomes possible to derive indicators showing the value of a territory’s natural assets, so that the value can be compared with that of produced assets or financial assets in the economy of the territory. One example is a composite indicator of the use of natural resources, which characterizes the social value of environmental resources, reflecting their scarcity and the effect (both positive and negative) of using these resources for the benefit of the present and future well-being of society. In practice, there are no social prices for most natural assets. A simpler approach is to measure the stock of resources from the point of view of the producer by using the discounted expected flow of economic benefits for producers as the evaluation criterion. Most of the indicators required for calculating environmental assets can be obtained from the physical and monetary asset accounts in Chapter 5 of the Central Framework for SEEA (section 5.5: mineral and energy resources; section 5.6: land; section 5.7: soil; section 5.8: timber resources; section 5.9: aquatic resources; section 5.10: other biological resources; section 5.11: water resources).
Obviously, as the SEEA accounts are further developed and made publicly available, the scope for transnational comparisons and monitoring of the OECD Green Growth Strategy are becoming greater. However, the task of encompassing ecosystems remains challenging.
Indicators for monitoring environmental activities and instruments and their roles in economy. Some of these indicators are covered by the tables in the Central Framework for SEEA119. The first indicator refers to environmental production. Economic opportunities can be considered by examining the role of “green industries,” trade in “green products” and creation of “green jobs.” However, experience shows that these concepts are often difficult to pin down statistically. A reliable starting point is provided by the indicators included in the Manual for measuring the environmental goods and services industry. Production of these goods and services, initially focused on eliminating the most acute ecological problems by solving issues related to output, is now geared towards innovation and integrated clean technologies that can prevent pollution, improve resource efficiency and minimize resource consumption.
It should be noted that the production of environmental goods and services and creation of jobs in the Environmental Goods and Services Sector is considered being only one aspect of the potential for green growth. Efforts undertaken in “traditional industries” (e.g., increasing energy efficiency in mining or steel production) can also put the economy on the path towards low-carbon and resource-efficient growth. These changes play an important role, although they are often triggered by cost or competitiveness considerations rather than environmental concerns. Therefore, creation of jobs and firms in the Environmental Goods and Services Sector should not be mistaken for the creation of “green jobs.” To date, there is no internationally agreed definition of a “green job.” Such jobs can be found in any industry or sector of the economy, regardless of whether specific products correspond to the goals of environmental protection. Indicators based on the Environmental Goods and Services Sector statistics (see Section 4.3.3 of the SEEA Central Framework) provide an internationally consistent set of definitions and classifications that can be used for cross-country comparison and assessment of best practice.
Other indicators still under discussion within the Green Growth strategy concern environmental expenditures. Efforts to reduce pressure on the environment depend on public and private expenditures for the following purposes: financing measures to protect the environment; financing resource management and conservation; and financial and technical support for the implementation of environmental protection measures in other countries. Monitoring the level of such expenditures and their change over time provides a general picture of the amounts, which a country spends on prevention, control and lowering the pressures of pollution and resource use, and on efficient management of natural resources and materials. The most general indicators characterize expenditures on prevention and reduction of pollution and preservation of biodiversity, the contribution of environmental activities to the economy, transition to pollution prevention technologies and the correlation between environmental expenditure and other kinds of expenditure. These indicators are useful for raising awareness about financial efforts undertaken by society to prevent, mitigate or reduce pollution. Section 4.3.2 of the SEEA Central Framework makes direct reference to such indicators.
The final category contains indicators related to environmental financial flows and policy responses. Economic instruments play an important role in public policy for building a resource-efficient economy. Such policy is a part of basic efforts for stimulating green production and consumption and promoting development and the introduction of new technologies and innovations. Prices and financial transfers (including taxes and subsidies) represent an important signal for producers and consumers and, together with existing rules, serve as tools to internalize externalities and guide the behavior of market participants towards more environmentally friendly patterns. The most general indicators provide information on the level and structure of tax receipts (e.g., transition from taxation of labor and corporate profit to taxes on consumption and use of the environment). This topic is considered in Section 4.4.3 of the SEEA Central Framework.
In general, compilation of the basic tables of the SEEA Central Framework helps to generate a well-adjusted set of data for a large number of indicators stipulated by the OECD Green Growth Strategy.
The aim of environmental statistics and various systems of shared use of environmental information is to show and assess parameters of various components of the natural environment (ambient air, water resources, biota, land resources, etc.), the negative man-made impact on them, and quantitative and qualitative characterization of the state of the environment. As recently as a decade ago, the data of environmental statistics were among few sources of information for such assessment. Appropriately chosen estimates, based on a sufficient data time series, can reflect basic trends and help to describe the causes and effects of the existing environmental situation; they also provide information on the implementation of environmental policies and evaluate their efficiency.
The system of indicators of environmental statistics has taken shape over the last four decades, since the early 1970s. The conceptual foundation of the environmental statistics has been developed over this period at the initiative of the Conference of European Statisticians. The first version of the Framework for the Development of Environmental Statistics (FDES) was published in 1984; the final version under the same title was approved at the 44th session of the UN Statistics Division in February 2013. The recommended core set of indicators includes the following components:
- environmental conditions and quality, environmental resources and their use;
- recycling of production and consumption residuals;
- extreme events and disasters;
- human settlements and environmental health;
- environmental protection, management and engagement.
The complete list of indicators of environmental statistics, including the above components, is now being published in the Russian Federation (Tatarinov, 2014).
In order to ensure practical implementation of the core sets of environmental statistics in the EECCA countries (which include Russia), the Joint Task Force on Environmental Statistics developed a manual for their practical application in 2007 (UNECE, 2007). The manual included in the Framework for Development of Environmental Statistics presents the indicators recommended as core statistics both from the standpoint of the existing requirements and data availability and with full consideration for their compliance with international recommendations. The choice of indicators for implementation is based on their inclusion in the following international lists of statistical indicators:
1) the list of Indicators of Sustainable Development Goals proposed by the UN Commission on Sustainable Development;
2) Questionnaire on Environment Statistics of the UN Statistics Division/UN Environment Programme (UNEP);
3) the list of indicators used in the environmental performance review program carried out by the UN Economic Commission for Europe (UNECE);
4) a list of indicators included in reports at ministerial conferences on the European environment (Kiev Assessment, etc.);
5) proposals by the World Health Organization (WHO)/European Bureau on the core list of environmental health indicators for the European region.
Depending on their role in the assessment of a specific issue, indicators are classified according to the EEA model: “driving forces – pressure – state – impacts – responses.”
The UNECE Joint Task Force for the production and online sharing of the selected environmental indicators, carried out since 2009, makes a major constructive contribution to the improvement of environmental statistics in the EECCA countries120 . The Task Force has been a forum for interaction and improved collection of environmental information, enabling unification of both the indicators themselves and the procedures of their generation and analysis for subsequent reporting. This makes the whole process of deriving statistics across European countries more consistent121 . The work is structured in two main directions: production of environmental data according to the approved methodology; and online exchange of environmental indicators using national websites and presenting the data analysis in accordance with principles of clear-cut and meaningful information sharing.
The countries engaged in this process dealt with eight indicators. These embraced five themes: atmosphere, climate change, water resources, biological diversity and waste. At its 9th session in November 2014, the Joint Task Force decided to add a further six indicators. The new key set of 14 indicators and 44 sub-indicators (the core set) contains additional statistics on water resources and biodiversity together with such themes as agriculture and transport122 .
So the environmental indicators do more than simply produce data. The indicators, derived on the basis of adequate inputs and time series reflect main trends, describe the causes and effects of the existing environmental situation, enabling comparisons between countries and evaluation of efficiency of the environmental policy, which is in force. The information obtained is made generally available by creating and maintaining respective websites for data presentation and exchange.
The integration of environmental data has expanded in scope since 2008 when it was decided to create the SEIS (Shared Environmental Information System123 ). The main purpose of SEIS creation was to update and simplify collection, exchange and use of data and information (including statistical and departmental materials, inputs from scientific, research and other interested organizations, etc.) required for the development and implementation of environmental management, by creating data bases and ensuring virtual communication between them124 . The environmental data are stored in electronic data bases of various countries, which are linked together to ensure easy access for all stakeholders.
There are five main vectors for SEIS development:
1) generation of compatible content across themes and geographical levels;
2) diffusion of comparable methods for measuring progress towards a green economy and for assessing the results achieved in many spheres in respect of natural resource components;
3) deployment of various technologies to create information infrastructure which can underpin the gathering, use and assessment of information;
4) organization of and easy access to relevant knowledge, including assessments of the knowledge;
5) improved coherence in and use of assessment findings by providing better access to existing results and assessment approaches (EEA, 2011). In recent decades map-based monitoring and visualization of environmental data sets have played a significant role in improving information processing and in the display and interpretation of the results, modeling the processes that occur in the Human-Society-Nature system.
Main principles of information processing were defined during creation of the SEIS125 .
1) Information should be managed as close as possible to its source;
2) Information should be shared with others for various purposes:
- be readily accessible online to end-users
- be readily accessible to the general public in the respective national languages;
- be readily available to public authorities to assess the state of the environment and the effectiveness of policies timely;
3) It is expedient to make comparisons on the appropriate geographical scale (e.g., regions, countries, cities or catchment areas).
4) Information sharing and processing should be supported through common, free open standards.
The decisions of the seventh conference of environment ministers “Environment for Europe” (Astana, September 2011) gave a significant impetus to work on the Shared Environmental Information System (SEIS) The 2014-2015 126 assessment of progress achieved showed that a substantial part of the SEIS had been successfully created in the pan-European area. Also, a concept for measuring progress in SEIS creation and functioning was deployed for the first time in 2015127 .
According to the concept, each parameter is assessed by the criterion of its online accessibility. Any additional information is assessed in a similar fashion.
This was the first time that consideration had been given to the production and exchange of additional key indicators, such as renewable freshwater resources, uptake of freshwater, total consumption of drinking water, the quantity of protected and endangered species, mineral fertilizer consumption and passenger turnover. These indicators were chosen to ensure the availability of at least 14 key estimates, which were used for regional performance assessment in 2015 and 2016, including preparation of the Sixth Global Environment Outlook (GEO 6) by UNEP.
Now, therefore, the SEIS is perceived as an innovative online resource containing an extensive and well-structured selection of diverse environmental information, which is permanently updated. The information, particularly environmental statistics, is accumulated on national websites. Consistent and comprehensive use of SEIS approaches enables a fresh look at the environmental indicators themselves and reveals new opportunities for their use.
The environmental statistics and the extensive SEIS data base provide answers to fundamental questions regarding resource use and environmental protection. Nevertheless, the existing indicators, despite their broad range and multidimensional character, sometimes fail to present a complete picture, particularly as concerns links with the economy or social sphere. The indicators themselves, although they do not record processes between the environment and the economy, nevertheless provide relevant data for environmental economics.
At the present time a large number of globally significant breakthrough technologies are being introduced throughout the world and their integrated impact on sustainable development is impossible to predict. Many experts believe that a certain period of chaos or bifurcation is inevitable. It is not accidental that the notion of sustainability is often supplemented or even replaced by the term “resilience” as related to stamina or a lower degree of vulnerability. When the period of instability ends and a new stability is achieved, the global image of the world will be materially changed. Obviously, it is important to ensure that the new development scenario is favorable for the survival of humankind, countries and nations.
As discussed in Chapter 1, the upcoming technological revolution dictates close integration of goals of politics, sustainability and innovation, in order to overcome dependence on “dirty,” resource-intensive development128 . A more integrated and system-oriented approach to development priorities offers new possibilities for solving various complex global problems facing humanity; it expands the boundaries of commonly understood economic prosperity by acknowledging the importance of resisting climate change, depletion of natural resources, ecosystems and biodiversity, and the reduction in life-expectancy due to environment pollution. However, methods of public regulation in many countries have not caught up with the pace of technological development, and this hinders innovation, particularly in respect of resource efficiency, recycling, etc.
As the experience of many countries has shown, innovation transition exacerbates social contradictions and even causes conflicts in some countries, due to complicated teleological issues that interfere with the application of a “foreign” methodology and make it hard to introduce positive practices in certain specific socio-cultural conditions. The largest ever UN Summit, Rio+20 in 2012, acknowledged the inevitability of diverse approaches in the framework of the world development mainstream 129 .. This is an understandable reaction to failed attempts at borrowing foreign experience in semi-periphery and periphery countries attempting to catch up with the most developed economies. As Toynbee has rightly said, “unfortunately, professional western advisers on managing transition of the post-communist states to market capitalism – economists, financiers, business leaders, politicians – gave rise to false expectations... They left out of account the fact that the highly complex structures of laws, institutions and customs, which had been formed in the capitalist countries over long centuries, were the very pillars of modern market systems.”
In the SEEA context this means that external requirement for radical reformation of national statistics (as a necessary initial stage of transformation) may not be tenable in a specific country as compared to the practices of the most developed economies. Our experience shows that the most productive systematic solution is to obtain initial acceptable results and compile SEEA matrices based on the broadest application of the existing systems of primary accounts, minimizing financial and administrative costs (Cadaster Institute, 2007-2009; Fomenko G., Fomenko M., Markandya & Perelet, 1997a). Then, after the primary systematic picture has been obtained, work can be continued to obtain more adequate indicators. Such an approach gives prompt results that are useful for the national and regional authorities in determining strategic priorities for resource use and environmental protection.
The new synthesis of environmental and economic indicators with socio-cultural dimensions is methodologically complicated and requires careful elaboration. The System of Environmental-Economic Accounting seems to be the most suitable platform in this respect, since it allows the application of systemic approaches to the description of links between the environment and the economy (from parts to whole, from contents to patterns (section 1.1)) and is capable of self-evolution to account for socio-cultural dimensions. For the present, however, the focus of attention in the SEEA is on relations between the environment and the economy: economic activities and environmental processes are only examined to the extent that is necessary for understanding of these relations. In its current form, the SEEA has not defined links with the data sets of socio-demographic statistics. The task of discovering links with ethnometric dimensions, which are being actively studied by researchers (Hofstede and others), has not even been set.
At the UN level, development of the system of environmental-economic accounting is recognized as one of the main vectors for building a new management ethics in the 21st century (Annan, 2000) and as the principal tool for analysis of the development of countries and regions. Unfortunately, this statement, with its deep philosophical implications, is often neglected by the expert community. But it is precisely the SEEA, which makes it possible to investigate resource users’ behavior in specific territories by discovering flows in the non-regulated economy and examining the price space (Fomenko G., 2000) in its whole multiplicity and dynamics. New approaches for revealing the motivation of users and incorporating respective findings in the decision-making process show ways to mitigate the consequences of globalization for local communities, to overcome environmental poverty, and to prevent and resolve environmental conflicts around the world.
The resulting information-analytical base for environmental management makes it possible:
1) to monitor environmental changes caused by economic activities, analyzing direct and indirect impacts of the use of environmental resources on the state of the economy;
2) to define the socio-culturally determined corridor of institutional changes that are acceptable for a specific community in implementation of the global goals of sustainable development. The use of the SEEA as a platform for such synthesis not only helps to incorporate environmental elements in economic theory and economic decision-making, but takes account of the behavioral peculiarities of specific communities by adopting an extended system of indicators.
On the practical side, the required improvement of the information-analytical base implies socio-cultural tuning of approaches, formats and estimates that are used to derive relevant data for reflecting the territorial aspects of environmental management. The main aspects of such fine-tuning include:
1) unlocking the potential of the SEEA methodology and formats for deriving and recording estimates of the use of environmental resources and ecosystem services;
2) supplementing the environmental management information base with socio-cultural estimates that can be accepted, adequately interpreted and translated for decision-makers.
The potential of the system of environmental-economic accounting for revealing and recording socio-cultural features of territorial environmental management is methodologically determined by the very principle of obtaining data for deriving estimates to compile tables and accounts. According to the UN guidelines (UN, 1993a; 1994a; 1994b; 2000; 2014; UN, European Commission, IMF, OECD & World Bank, 2003), estimates for economic valuation of stocks of environmental resources and ecosystem services, flows of use and other changes in the composition of natural assets are derived from the basic provisions of the theory of total economic value. The valuation is based on three main approaches:
- direct market valuation (based on actual income earned from the use of natural assets and determined by market prices, tariffs, fees, etc.);
- direct non-market valuation (based on users’ subjective opinions about the value of environmental resources and ecosystem services and determined by data on willingness to pay for the preservation resource use flows);
- indirect non-market valuation (based on actual user cost incurred due to damage the need to comply with certain standards). Complementing each other, these approaches compensate for market failures caused in the economy by the undervaluation of many environmental resources and ecosystem services. It is just as important that such valuations are compatible with and complement valuation methods used in respect of other assets (e.g., property items). The resulting multidimensional character of the geo-economic space offers greater insight into the behavioral motivation of resource users. The validity of the above premises is confirmed by the outcome of numerous studies carried out by Cadaster Institute for the valuation of environmental resources and ecosystem services (Chapter 3), e.g., valuation of town parks and suburban forests (Table 4.3).
Table 4.3 Structure of total economic value of town parks and suburban forests according to the SEEA methodology
|
№ |
Type of valuation |
Value obtained |
|||||
|
Yaroslavl Region, Danilov, Gorushka Park |
Kaluga Region, Kondrovo Urban Park |
Kostroma Region, Kostroma, Berendeyevka Park |
|||||
|
mln. rubles |
% |
mln. rubles |
% |
mln. rubles |
% |
||
|
1. |
Direct market user value (sanitary thinnings, mushroom, berry harvesting, fishing, etc.) |
1.1 |
0.4 |
0.1 |
0.1 |
0.5 |
0.2 |
|
2. |
Indirect user value (by carbon sequestration capacity) |
34.8 |
13.6 |
7.3 |
3.4 |
2.7 |
0.7 |
|
3. |
Existence value determined by subjective valuation (willingness to pay for the set of ecosystem services) |
215.1 |
86 |
205.9 |
96.5 |
370.3 |
99.1 |
|
4. |
Total |
251.0 |
100 |
213.3 |
100 |
373.5 |
100 |
Source: Preobrazhensky, et al., 1999; Cadaster Institute, 1997b; 2000a.
The data contained in Table 4.3 definitely prove that direct user valuation cannot fully characterize the value of sites as regards the preservation of biological diversity, and of natural and cultural heritage. So the systematic neglect of non-market methods of valuation in compiling environmental-economic accounts in the SEEA framework gives distorted (understated) values of resources and environmental items, aggravating the anti-ecological trend in management decisions made on the basis of such valuations. From positions of the homo responsabilis model (Fomenko G., 2017), which is also oriented to ethical values, estimates based on market prices are supplemented by “humanized” estimates derived on the basis of non-market values. Consistently greater attention to subjective and indirect valuations expands both the scope of analysis of the benefits provided by natural resources and ecosystem services and the range of possible decisions in the environmental sphere.
Each of the indicators that make up total economic value conveys information about the behavioral choice of people as to environmental solutions at a specific time in a specific territory. Our studies showed that this important information is provided by the indicators themselves and by their correlation.
The extent, to which estimates of the value of environmental resources and ecosystem services (derived from market prices) correlate with estimates showing customer perception of their total economic value, is of particular interest. This parameter shows the degree of undervaluation of natural assets and can be called the “environmental indicator of market failures”130 or EIMF (formula 1).
IMF = MP/EV, (1)
where: MP is the direct market value of environmental resources and ecosystem services based on market prices;
EV is the total economic value of the environmental resources and ecosystem services calculated by formula 2:
EV = Vdu + Viu + Vov + Ve + Vs, (2)
where: Vdu is the direct user value;
Viu is the indirect user value;
Vov is the option value
Ve is the existence value;
Vs is the succession value
Importantly, the value of the “environmental indicator of market failures” is always less than unity owing to the fundamental impossibility for the market to reflect all components of the total economic value of environmental resources and ecosystem services. In 1998 the EIMF for Gorushka Park in Danilov (Yaroslavl Region) was 0.44, for the Urban Park in Kondrovo (Kaluga Region) it was 0.05 and for Berendeyevka Park (Kostroma) it was 0.2. It should be noted that Gorushka Park, having a church in its territory, receives a much higher estimate than Kondrovo, which has no special sites and is traversed by a road. This indicates that the former site has a greater chance of preservation (based on opinion polls of residents). Overall, the results obtained show substantial market undervaluation of these natural sites, and this should be taken into consideration when designing sustainable development strategies.
Historically, values of the environmental indicator of market failures demonstrate the extent to which the market is more or less sensitive to environmental values of specific territories over a specified period of time. By analyzing the indicator and its dynamics, we can see whether and to what extent the environmental regulation mechanisms applied in a specific territory compensate for market failures. So the use of this indicator ensures better evaluation of the efficiency of environmental management, helping to discern trends, peculiarities and limits of managerial actions, which would help them to be favorably perceived by the local population and successfully implemented.
As well as providing important valuations, the SEEA offers broad opportunities for reflecting socio-cultural, generally non-formalized features of territories thanks to its approaches to data collection in compiling accounts and tables.
Special attention is paid to ensuring the fullest possible scope regarding existing stocks and flows in the use of environmental resources and ecosystem services. The system allows the use of information obtained from other sources, including expert data, alongside official statistics. The projects carried out by the Cadaster Institute have proved the feasibility of compiling additional SEEA accounts131 which, unlike ordinary accounts, are based on informal information, i.e., information not captured by statistics and administrative reports, regarding stocks, flows and other changes in environmental resources and ecosystem services.
In this way, the scope of investigation is expanded by inclusion of large amounts of information reflecting the so-called non-regulated economy. In view of the existing statistical traditions and the complexity of deriving primary data, this sphere includes, among others, such issues as household subsistence, illegal extraction of natural resources (poaching, etc.) as well as resource consumption below the minimum threshold for statistical records. The expansion of the information base improves the validity and applicability of the data obtained and encourages decision-making based on such data, which is therefore likely to have more weight and relevance in the context of local environmental and socio-cultural conditions. It is of great importance that, consistent with the SEEA methodology (Central Framework of the SEEA, Introduction, paragraph 34, section 1.3.1, section 1.3.2), special attention in compiling accounts and tables should be paid to physical accounting. Our studies show that the complete and detailed coverage of the data in physical terms, both for analysis and generalization, ultimately ensures the derivation of appropriate value indicators.
So the fullest possible implementation of the SEEA approaches and formats for derivation and use of indicators showing the value of environmental resources and ecosystem services (in monetary and physical terms) expand and actualize the information base of environmental management in accordance with the principles of sustainable development and greening of the economy. It is important that such compilation of SEEA accounts for territories at different levels (national, regional, local) with their consistent aggregation at higher levels of territorial organization ensures analysis and generalization of the socio-cultural peculiarities of existing environmental management. It also becomes possible to identify trends in environmental activities that are likely to be approved and supported by the residents of specific regions, towns and settlements. Such analysis may also be useful for assessing the efficiency of environmental investments in a specific territory as it highlights contradictions between the economic motivation of private investors (driven by actual market prices) and public interest (mostly expressed in terms of total economic value).
Socio-cultural indicators supplement the information base for environmental management, enabling better interpretation and translation to decision-makers. As mentioned above, the SEEA can provide information, which was formerly unavailable and which is useful for sustainable environmental management and protection. Besides, important information on global environmental changes is increasingly provided by aerospace sensing, with information exchange promoted over the Internet. This creates an illusion that decision-making processes will automatically become more sophisticated and sustainable. At least, such a conclusion suggests itself proceeding from classical economics with its model of economically sustainable behavior.
Unfortunately, that is not the case. The actual range of options available to resource managers (White, 1990) is directly determined by what people believe in; their beliefs, in turn, depend on a culturally tinted image of themselves and their surroundings. That is why timely recognition of resource users’ preferences is so important in the practice of environmental regulation. As mentioned above (in the preceding section), a useful tool for solving this problem, apart from identifying informal relations as early as at the stage of physical accounting, is application of the total economic value methodology in the framework of SEEA. This is particularly important in valuation of ecosystem services (based, among other things, on willingness to pay and willingness to obtain remuneration, etc.).
SEEA approaches are largely based on current views of behavioral economics and behavioral geography, which take account of the irrationality of human behavior. The basic methodology of behavioral economics has developed rapidly and received ever increasing recognition. Suffice to mention the Nobel Prize for Economics won by Kahneman (shared with Smith) in 2002 “for having integrated insights from psychological research into economic science, especially concerning human judgment and decision-making under uncertainty.”
The research efforts of the founders of this relatively new scientific area, Kahneman and Tversky, have been focused on mechanisms of human decision-making in conditions of uncertainty132 . The researchers set out to show that decisions made by real people exhibit significant divergences from what is envisaged by the standard economic model of homo economicus (Kahneman, 2014; Kahneman, Slovic & Tversky, 2005). Instead of decision-making theories based on the calculus of probability, Kahneman and Tversky suggested a new theory, which they called “prospect theory.” According to this theory, reasonable people are unable to properly evaluate future benefits in absolute terms; instead, they evaluate their gains and losses against a certain reference standard, striving first and foremost to avoid any worsening of their condition. Prospect theory helps to explain numerous cases of irrational human behavior, which are inexplicable from the position of homo economicus.
From the point of view of more efficient use of information provided by the SEEA for resource use and environmental protection, the following provisions are extremely important.
First of all, it has been discovered that people respond differently to situations that are equivalent in terms of benefits and losses, depending on whether they lose or gain. This is caused by an asymmetric response to the change of well-being. People are willing to take a risk in order to avoid losses but reluctant to risk in order to gain benefits.
Secondly, according to the experiments, people tend to miscalculate the theory of probability: they undervalue the probability of events that are likely to occur and overvalue less likely events. Scientists have discovered an interesting phenomenon which shows that even people well versed in the theory of probability do not rely on their knowledge in real situations, but proceed instead from their stereotypes, prejudices and emotions.
Differences in behavior stereotypes of different nations have been known since ancient times. An outstanding example of research into national mentality at the qualitative level is presented by the works of the early 20th century Russian philosophers, who examined aspects of the “character of the Russian people.” The research acquired a special poignancy in the works of outstanding representatives of the Russian post-revolutionary emigration, who sought to understand the causes of the cultural breakdown in Russia. These were writings by Berdyaev, Lossky, Ilyin, Bulgakov, Fedotov and others.
Unfortunately, behavioral economics as such has not gained ground or practical application in Russia as yet. The same can be said of behavioral geography (Gold, 1990), a new branch of social geography that evolved as a self-contained scientific and constructive discipline in the late 20th century. Behavioral geography is not only focused on the perception of the environment by an individual, group or society, but also on particular aspects of human behavior in different spaces, including information space, paying special attention to the principles of formation of an optimum living space. As of today, we also not aware of any Russian publication or handbook devoted to cognitive geography, which is an important branch of cultural geography investigating how humans view space, place and environment, the mechanisms of effective representation of space and how they are used in human activities.
Our studies over the last 20 years in various regions of Russia, investigating the behavioral preferences of resource users, have confirmed the partially rational decision-making by actual resource users and the significant role of value-oriented perceptions and views in this process. For these reasons G. Fomenko set out to prove the limitations of the model of rational behavior of homo economicus, inherent in classical economics, when it is applied to issues of sustainable development and environmental management. He suggested, instead, the model of homo responsabilis, which acknowledges the importance of the value system of each person, thus countering to some extent the partially rational decision-making in environmental activities.
Applying this model implies understanding socio-cultural preferences and constraints that determine the range of choices acceptable for individuals. It also suggests a broader application of the methods of hermeneutic cognition133 . In this context it is important to look into the possibilities of hermeneutics as a theory of interpretation and comprehension.
According to the non-classical hermeneutics, which arose in the 20th century and its leading proponents (Heidegger, Gadamer, Ricoeur), understanding is to be considered in a very broad sense as a fundamental ontological characteristic of human existence. A human being lives by understanding. Understanding is an ontological characteristic; it is related to language and inseparable from dialog. Gadamer stresses that there is no “absolute position” for an observer. It is impossible to assume the position of a supra-temporal, supra-historical subject or to find a timeless absolute truth. The ontological condition of understanding is its rootedness in tradition. Gadamer shows that understanding, interpreting and using are not different procedures; all these processes are identical. Comprehension means interpretation and interpretation means understanding.
Transition to the model of homo responsabilis, with its intention to overcome partially rational behavior of resource users through focus on non-economic values, entails the necessity of creating a system of relevant indicators (in addition to the SEEA).
Such indicators have been derived recently thanks to new tools of socio-cultural studies, primarily ethnometrics, which have been developed over the last decades. The idea that value can be allocated to various cultural dimensions has been realized in practice. The approach is based on translation of qualities into quantities, with further comparison between the derived indexes and interpretation of the results obtained. Widespread recognition of this model appears connected with the emergence of new technologies that enables rapid macro-analysis of micro-data, including those referring to human behavior in the Society-Nature system.
There are a number of scientific approaches to measuring culture:
1) the system of indexes suggested by Hofstede (1980; 1997; G. Hofstede, G.J. Hofstede & Minkov, 2010) (considered founder of ethnometrics), which was later modified by Inglehart (Inglehart, 1990; 1997; 1999) and House and Hanges (1999);
2) cross-cultural studies by Schwartz (1992; 1994a; 1994b);
3) cultural syndromes by Triandis (1995);
4) culture parameters suggested by Trompenaars and Hampden-Turner (2004);
5) social axioms of Bond et al. (2004).
In our view, the methodology of cross-cultural analysis developed by Hofstede is of greatest use for understanding and translation of the SEEA results, indicators of green growth, environmental statistics and other estimates of resource use for management purposes. Hofstede’s method is generally recognized and classical. It is appealing to scientists from different countries, which use it as a basis for studying various aspects of human mentality. Hofstede identifies four dimensions to characterize and describe the mainstream value systems of people from different nations and ethnic groups: power distance index (PDI), uncertainty avoidance index (UAI), individualism versus collectivism (IDV), and masculinity versus femininity (MAS). A fifth dimension was added in 1991 based on the outcome of studies by Chinese researchers and has been further developed by Bond for cross-country comparisons134 . This dimension, based on Confucian dynamism, was called long-term orientation, meaning orientation to the future (short-long)135 . A sixth dimension was added in 2010 following Minkov’s analysis and was defined as indulgence versus self-restraint136 . The set of the above indexes could be usefully supplemented by an index which might be called “stability of property rights” and which would assist better understanding of the fundamentals of resource use and environmental management in specific socio-cultural conditions, as well as enabling more efficient decision-making by actual resource managers (Fomenko G., 2014).
Widespread efforts are being undertaken today to use the socio-cultural indexes to study how culture influences environmental issues. The works of Park et al. (2007) are of special interest, since they use Hofstede indexes to investigate the relationships between culture and environmental sustainability. Also, Peng and Lin have found that power distance (PDI) and masculinity (MAS) can be “efficient and uncontroversial predictive indicators of environmental costs” (Peng, Yu-Shu & Shing-Shiuan, 2009). Vachon (2010) has discovered that cultural indexes of nations with a high degree of individualism and uncertainty avoidance correlate with indexes of corporate sustainability. He analyzed the dependence of cultural indexes on four variables: green corporatism, environmental innovation, fair labor practices and corporate social involvement; and looked at their relationship to environmental activity. An important conclusion was made: “the society that promotes collectivism” meaning “group cohesion and consensus” does not generally support “bottom-up” movement in environmental and social spheres, as it implies pressure on existing organizations and institutions, which disturbs the equilibrium in a specific place or country (Vachon, 2010).
Williams and Zinkin (2008), studying the relationship between social responsibility and Hofstede indexes, revealed that “consumers in countries where individualism is strong generally tend to punish a firm for environmentally unfriendly behavior more often than in the countries that favor collectivist attitudes” (Williams & Zinkin 2008). Studying the dependence of environmental sustainability on economic development with the help of Hofstede indexes, Husted (2005) proved that individualism, masculinity and power distance are correlated with sustainability to a much greater extent than had been expected.
The importance of the factors of power distance index (PDI) and the property right index (PRI) was shown by G. Fomenko and V. Fomenko (2013) based on the study of institutional factors associated with the import of environmental institutions and connected with the task of encouraging reduction of environmentally unfriendly outputs. The cross-country analysis carried out by the authors proves that the priori choice of environmental institutions exerting economic influence with respect to environmentally unfriendly products is governed by the following factors:
1) how precisely property rights are defined and whether there are historical traditions of compliance with such rights;
2) how much power and regulatory authority is concentrated at different levels of the territorial administration;
3) prevalence of voluntary involvement or command enforcement;
4) stimulating or suppressing effect (Fomenko G. & Fomenko V., 2013). One might also suppose that factors 3) and 4) are related to the masculinity index (MAS): command enforcement is more characteristic of masculine cultures, while volunteering is closer to feminine cultures; stimulating effect is inherent in feminine cultures, while masculine cultures tend more towards suppression.
Complementing the SEEA with socio-cultural dimensions opens up new prospects for the management of resource use and environment protection. Even a broad view of Hofstede tables137 suggests that the experience of the post-Soviet area countries, Eastern and Central Europe, is of greatest interest and significance for Russia. Equally important is the experience of the BRICS countries (particularly China) where the recent decades have seen systemic cultural modernization touching upon the relations in the Society-Nature framework, taking proper account of socio-cultural peculiarities and involving both reinforcement of traditional cultural codes and rejection of those that hinder the modernization processes and the country’s sustainable development.138 It is interesting to look at numerical indicators of cultural modernization strategy in China: the index of modernization in cultural life; level of cultural competitiveness; index of cultural influence; 24 indicators of cultural evaluation and 30 indicators of cultural monitoring (Survey Report on Modernization, 2011).
Our studies have shown that complementing the SEEA with socio-cultural dimensions opens up a new approach to the interpretation of environmental-economic estimates. These dimensions should therefore be included in the methodology of management by objectives at all levels of government regulation. It is worth repeating that the use of socio-cultural indexes allows a priori estimate of a specific culture as a factor determining the choice of acceptable decisions on institutional or organizational changes in environmental management.
Meanwhile, any universal scale of reference in evaluating human behavior should be used judiciously, in view of its highly general character. When interpreting the results of such evaluation in each specific case, it is expedient to consider the particulars of the existing situation and use cultural dimensions only as indicators of the cultural environment, which facilitate the decision-making process. Besides, no socio-cultural index can predict the behavior of individuals with their specific personalities.
It should be noted that the set of socio-cultural indexes, their qualitative and quantitative characteristics, are not constant and can change over time. Changes, however slow, do occur, although adjustments have occurred more quickly in recent periods. From the standpoint of environment management and national long-term interests, it is important to ensure that changes correspond to the upward trend of vital resilience and that they are irreversible, thus providing a better quality of life with minimum losses to natural wealth. Socio-cultural dimensions in respect of environmental sustainability and resource use should therefore be monitored on a regular basis, which would further align them with the SEEA.
The variety of approaches to self-development of territorial institutional systems within the framework of the common development mainstream is acknowledged today at the highest international level139 . This important position in respect of sustainable development entails two basic consequences for the SEEA methodology: first, the unity of the basic approaches (ensured by UN statistical standards); secondly, focus on the broadly conceived geographical conditions encompassing natural, economic, social and cultural characteristics.
The SEEA can be regarded not only as a data base but also as a special environmental institution stipulating systemic relationships between indicators in the complex non-equilibrium Society-Nature open system. Because the evolution of statistical systems and institutions is rooted in the past, many processes in their present-day development can be explained by the socio-cultural features of territories and described by using new approaches, such as path dependency theory and the QWERTY effect. This trend was pioneered by Paul David (1985; 2000) who showed in his oft-quoted paper that the generally accepted keyboard layout known today as QWERTY has resulted from the time-remote fact that a less effective standard won out over a more effective one due to a series of specific, rather accidental circumstances at the moment of choice, with any subsequent change of the standard appearing impossible because of prohibitively high costs. The path dependency concept (North, 1997; Arthur, 1994; Liebowitz, 2002) extends dependence on the path to a wider class of phenomena, including economic institutions seen as the “rules of the game in a society, constraints that organize relations among people” (North, 1997).
The above provisions of neo-institutional theory dictate that for the SEEA to evolve, there has to be compliance with unified methodology at the level of UN standards, but account must also be taken of specifics in the development of national statistics in the framework of the broadly conceived geographical conditions of countries and regions. The correct interpretation of results obtained by external experts as to the socio-cultural context of the territories under investigation is of the highest importance. For example, the valuations of rural water supply in Yaroslavl Region (Loshadkin, 2001; Fomenko G. & Fomenko M., 1999) appeared to be underestimated not only due to low income of a large part of the population but also due to the profound socio-culturally determined perception of water as a public good (“God’s gift,” as it was called in the course of questionnaires and opinion polls).
As regards work to apply the basic SEEA approaches, the main mistake, in our view, is the recurrent demand of external experts to raise the quality of primary statistics for deriving estimates (even to the level of developed economies) as a prerequisite for successful development of the system of environmental-economic accounting. Although it is certainly desirable to use reliable statistics, such a requirement can be a hurdle for many less- and medium-developed countries.
In our view, the most efficient approach sets the task of compiling SEEA matrices by making best use of the existing systems of primary accounting and expert data (Cadaster Institute, 2007-2009; Fomenko G., Fomenko M., Markandya & Perelet, 1997a). Such an approach can provide prompt results at the lowest possible cost, offering valuation sets that are useful for national and regional authorities (with compulsory statement of the assumptions that are made). The final results can be efficiently used in strategic planning and for the implementation of tax reforms. Otherwise, development of the SEEA may be left to the most developed economies, while others will witness an indolent, elitist process, which is incapable (due to information gaps in various countries) of presenting a unified image of the world, even in an aggregated form. The results obtained will have limited application, since (owing to gaps in official statistics) they will not be able to record important territorial differences, which is precisely the main purpose of the efforts.
Institutionally, it is advisable to begin work on adaptation of the basic SEEA methodology in each country and region by compiling basic SEEA accounts (consistent with the provisions of the first version of the SEEA guidelines) (UN, 1993a), through in-depth analysis of the genesis of each indicator and definition of its specifics, including those that are socio-culturally determined. So successful implementation of environmental-economic accounting in each territory can only be ensured by a “bottom-up” approach. Instrumentally, compilation of the SEEA matrices at lower levels of territorial organization will produce data whose aggregation allows movement to the higher territorial level of the SEEA, which has so far been unavailable for information analysis. Moreover, an in-depth behavioral interpretation of the contents and meaning of each estimate at the very start of the studies will help to avoid a situation where the higher-level SEEA may send the wrong signals to decision-makers. Today such approach has acquired special topicality for other reasons as well. As noted above, rapid development of the Internet and other communication media have created new opportunities for learning best foreign practices. It has become expedient to narrow down the notion of “best practices” under consideration. In other words, certain weak points of the very methodology of a priori appraisal of foreign experience for importation of SEEA “best practices” have been discovered.
According to our studies, the scenario for development of a system of environmental-economic accounting that is most appropriate for each country or region is chosen based on a set of factors that provide the most correct picture of the existing patterns and territorial peculiarities of environmental management. As a result of the expert examination of such factors, we established that the most important of them are those, which characterize: conformity to the global approaches of sustainable development; conformity to international standards in statistics and compatibility with the system of national accounts; correlation with the economic structure and production type; conformity to the allocation of regulatory functions at different levels of territorial administration; and correlation with the knowledge level in the territory.
1. Conformity to global sustainable development approaches
Providing resource users with new systemic information needed for solving practical tasks of transition to sustainable development at all levels of territorial organization is the main condition for successful implementation of the SEEA and its further functioning. The SEEA is the vital element in strategies of sustainable development of territories rather than merely one new internationally recognized trend in statistics. In our experience, decision-makers who fail to understand the significance of systemic changes for sustainable development of their country or region, tend to use the results of implementation of the SEEA approaches inefficiently or simply ignore them in their work. This fact often escapes the attention of the decision-makers themselves and the expert community as a whole, as is proved, in particular, by certain changes in international documents on the SEEA methodology where attention is gradually shifted from the role of primary information and territorial aggregation to the problems of processing data at macro level.
The goals and objectives of maintaining systems of national accounts were formulated as far back as 1992 at the Rio de Janeiro Earth Summit on sustainable development. The outcome document approved by all countries, Agenda 21 (point 8.41) states: “A first step towards the integration of sustainability into economic management is better measurement of the crucial role of the environment as a source of natural capital and as a sink for the by-products generated during the production of man-made capital and other human activities. As sustainable development encompasses social, economic and environmental dimensions, it is also important that national accounting procedures are not restricted to measuring the production of goods and services that are conventionally remunerated.” We believe this cannot be implemented without extending the SEEA methodology to the regional and sub-regional levels. The system of environmental-economic accounting in each territory should become a systemic pattern compatible with similar information systems of other countries and regions.
Of equal importance for all levels of territorial organization is the appeal of Agenda 21 to encourage recording of the economic value of natural resources and ecosystem services in national accounts in a way, which is correct from the positions of sustainable development140 . Methodologically, the aim of the SEEA is not only to derive current rent income. The aim is much broader: to show the dynamics of natural capital over time and the loss of its qualities due to various man-made impacts, including pressure from poaching and harvesting, i.e., the task is to derive, alongside rent, a certain sort of “anti-rent.”
2. Conformity to international standards in statistics and compatibility with the system of national accounts
The system of environmental-economic accounting, as a satellite system, should not break away methodologically from the system of national accounts and should conform to the main vectors of its development and content. Today the crucial vectors are:
1) systematic application of macroeconomic theory;
2) double-entry bookkeeping system;
3) possibility of using the data for developing economic and environmental policy;
4) application of electronic methods of data derivation and visualization.
Chapter 8 of Agenda 21 (1992) stresses the importance of unification of international approaches: “A common framework needs to be developed whereby the contributions by all sectors and activities of society, which are not included in the conventional national accounts, are included, to the extent consistent with sound theory and practicability, in satellite accounts.”141 The existence of the common SEEA methodology does not entail complete similarity of methods. Even the first version of the Handbook on Integrated Environmental-Economic Accounting (UN, 1993a) points out opportunities for the use of a wide range of methods of monetary valuation of natural assets. In this way the SEEA acquires the required flexibility and its implementation becomes possible even in countries with poor statistics systems.
3. Correlation with economic structure and industry type The extent of elaboration of elements of the national SEEA objectively reflect the structure and type of industry of a specific territory. Our studies (Cadaster Institute, 2007-2009) have shown that economies with predominant resource orientation tend to pay more attention to resource accounting and the identification of threats of economic and physical depletion of natural resources in developing their SEEA (Canada, Australia, New Zealand, etc.) Countries where processing industries and machine-building prevail are mostly focused on accounting for pollution factors (Germany, the Netherlands, etc.). Countries that assign high priority to the travel industry concentrate their attention on ecosystem services (e.g., small island countries, etc.). Therefore, when seeking to borrow foreign experience, there should be an orientation to the practices of countries with similar economic structure and industry type.
4. Conformity to the allocation of functions at different levels of territorial administration
The need for information in order to carry out government regulation, and the distribution of regulatory functions (authorities) at different levels of territorial administration largely dictate the structure of the SEEA. Therefore, when devising the SEEA mechanism, and the respective system of collection and processing of statistics, it is necessary to decide at which level specific data will be used and determine whether the government body operating at that level has sufficient powers and authority.
Different countries have different concentrations of regulatory functions at different levels of territorial environmental management. In the Netherlands, e.g., the role of the local level has traditionally been very important, to say nothing of the cantonal system in Switzerland. The regional level is of great importance in the USA. The Russian Federation has traditionally had strong centralized public institutions, and its environmental regulation is characterized by high concentration of legal powers at the federal level, including the economic regulation of environmental activities (Fomenko G., 2014).
That explains the dominant role of the federal level in developing the SEEA in Russia. At the same time, given the enormous size and geographical variety of the country, it is important to make sure that SEEA matrices are also compiled at regional level, particularly with respect to locally significant resources (e.g., forest and hunting resources, local construction materials, etc.). In addition, certain elements of the SEEA may be useful for strategic planning at the local level where the monetary value and the structure and dynamics of natural capital are of special importance. In this case, such analysis becomes a helpful tool for evaluating investment proposals from the point of view of sustainable development of the territory.
5. Correlation with the knowledge level about the territory
The level of knowledge about the territory determines the choice of methods used for gathering information and valuing the natural resources and ecosystem services to be used in compiling the SEEA, and shortage of data for precise calculation should not be regarded as an obstacle to implementation of the SEEA. Otherwise, it may prove impossible to obtain systemic estimates of SEEA in less-developed and sparsely populated countries and regions.
In a very broad sense, the level of knowledge about a territory can be estimated by answering the following questions: are data on natural capital and its use available? can these data be obtained? how are the flows of departmental information correlated with each other? are the methods of gathering and analyzing information consistent with the goals of environmental management? etc.)
Table 4.4 Typology of territory knowledge for compiling SEEA
|
Type |
General assessment |
Brief description |
|
1. |
Low |
Mismatched information flows predominate. Serious shortage of investment for new research efforts Access to information is restricted due to commercial considerations Low level of computer application |
|
2. |
Medium |
Gradual building of information systems that provide data collection, processing, storage, use and updating in the form of statutory, methodical, technical and accounting documents, information and map-based materials (including electronic materials) used for legal, economic and environmental regulation of integrated resource use in the territory. |
|
3. |
High |
Creation and operation of full-scale geo-information systems (GIS) with geo-simulation modeling of processes based on smoothly running flows of regional information sufficient for integrated territorial environmental management. |
Such aggregated analysis of territorial conditions enables selection of efficient methods from the list of various methods of gathering SEEA data. It should be noted that poor knowledge of the territory forces extensive use of expert methods of evaluation and aerospace remote sensing. If the level of knowledge is high, the opportunities for gathering and analyzing information for application in the SEEA are greater and the accuracy of accounting increases.
The general analysis of these factors in respect of the Russian Federation shows that design and development of the SEEA will face a tripartite challenge, with each part contradicting the others. The essence of the problem is that, on the one hand, we need to comply with the new universal SEEA standards adopted by the UN, ensuring a unified approach to the valuation of environmental resources and ecosystem services based on discounted cash flow methods and resulting ecological assessment of damage caused by economic activities, as dictated by the uniform base methodology. On the other hand, certain negative consequences of the shifts and errors of the post-Soviet period should be subject to revision and correction. But on the whole, whatever value there is in the inherited system of Russian statistics should be retained.
As regards opportunities suggested by the import of foreign best practice, we presume that, in the initial stage of work, Russia should rely primarily on the experience of the countries with resource-oriented economies, such as Canada and Australia (in the 1980s-1990s) and present-day India and Mexico. It would be useful to take advantage of the practice of the EECCA and the Central European countries, especially the Czech Republic, as all of them have a socialist background. The experience of the most economically developed European countries should also not be ignored. However, it should be noted that current development of the environmental-economic accounting in these countries is oriented mostly to the solution of environmental problems related to emissions and pollution rather than dealing with the environmentally and socially dangerous depletion of natural resources (an issue that particularly concerns resource-oriented countries).
CONCLUSION
The book demonstrates that creation of an effective environmental management system oriented towards achievement of the SDGs requires a change in approaches to information support. Under the conditions of accelerated technological transition to the post-industrial economy and the adoption of the Paris Agreement on Climate (2015), the measurability crisis is observed. When assessing the development trends of the end of the era, the current statistical and departmental information systems lag behind in identifying new growth trends and threats to sustainable development. In this situation, the need has increased not only for new indicators, but also for changes in the very approach to statistical monitoring of socio-economic phenomena.142
Under the conditions of active changes that have begun, we should analyze socio-economic phenomena and processes not in isolation, but in interaction, in interrelation; not in statics and steadiness, but in movement, in change, in development. The emphasis should be placed on inclusive green growth indicators in territorial development, with weakened emphases on industrial data collection. It corresponds to today’s demand for a balanced system approach to territorial administration.
We have studied this issue for more than 20 years, looking for answers to these questions.
What is the most important, in our opinion?
Today, the modern theory of sustainable development that is based on the system concept of Life, multivariance of the future, multiplicity of rationalities in natural resource use constitutes the most developed and acceptable methodological framework for maintaining Peace and preventing a global environmental disaster. The most important aspect is that in accordance with the Sustainable Development theory, man’s worldview, his idea about how the natural and social world works, in general, cannot be disrupted, ambivalent. Such understanding of sustainable development both forms new requirements and implies re-thinking of methodological framework for measurements in the system Society-Nature, primarily, statistical. The key criteria of new measurements are:
1) flexibility, i.e. the ability to see new emerging development trends in the system Society-Nature and to assess them;
2) the ability to provide necessary and sufficient information for work aimed at determining environmental and economic safety criteria that must be met to avoid non-controlled system destruction and the ability to find optimal values of system variables.
While working on the book, we became certain that recognition of multivariance of the future implies identification and assessment of possible scenarios-trends from the prospect of sustainable development and detection of those dangerous for humanity and ecosystems. Recognition of the necessity and feasibility of limitations to avoid negative trends implies a substantial increase in the role of indicators of impact on the environment and the importance of green growth indicators describing the processing between ecology and the economy. Therefore, within the framework of the SEEA, in the big picture of measuring natural capital amount and structure, it is feasible to timely form indicators characterizing the risks of its environmentally and socially dangerous exhaustibility. It allows prompt identification of the danger and ways to substitute shortfall in income (first of all, budgetary and household income) and, thus, to take actions to prevent conflicts in natural resource use at early stages.
The need for wholeness in the world perception in order to make balanced and holistic sustainable development decisions implies coordination and mutual agreement between humanitarian and natural-science knowledge. However, addressing this problem comes across the paradox that the laws of nature are the same for everybody in every place but worldviews, standards, ideals and attitudes towards oneself, others and the world around are different and sometimes incompatible and even hostile (Sadokhin, 2006), whereas man’s being requires approximation of natural-science and humanitarian cultures. Today, owning to achievements of the scientific and technical progress and the spread of the system approach, the former confrontation between the natural-science and humanitarian approaches has weakened considerably. We believe that ongoing additional efforts for instrumental support of the new synthesis are necessary. The existing SEEA basic methodology (especially, the first one of 1994) constitutes quite an efficient platform for approximation of these approaches, emphasizing their complementarity. The book shows the key areas of this synthesis: 1) humanization of ecosystem service estimates; 2) establishment of additional socio-cultural measurements for understanding, implementing the results and developing recommendations for institutional transformations in environmental protection in each country and community; improvement of statistical studies within the SEEA in the following aspects: statistical observations; primary processing, summarizing and grouping observation results; analyzing summarized materials. All these stages are interrelated, and if any of them is missing, it will lead to violation of the statistical study integrity.
References
Adala, D. O. (1987). A theoretical investigation of the willingness to pay for recreational services: A case study of Nairobi national park. Eastern Africa: Economic Review, 111-119.
Agenda 21. (1992). Adopted by the UN Conference for Environment and Sustainable Development. Rio de Janeiro. URL: http://www.un.org/ru/ documents/decl_conv/conventions/agenda21.shtm
American Library Association. (1999). Task Force on Metadata. Summary Report. June 1999.
Anderson, G. D. & Bishop, R.C. (1986). The valuation problem. In Natural resource economics: Policy problems and contemporary analysis. Ed. Bromley, D. W. Boston: Kluwer Nijhoff Publishing.
Anderson, G. D. (1987). The economics of afforestation. Baltimore: Johns Hopkins University Press.
Annan, K. (2000). Secretary-General of the United Nations. We the peoples: The role of the United Nations in the 21st century. The UN Millennium Summit (6-8 September, 2000). Report number: A/54/2000.
Arrow, K. J. & Fisher, A. C. (1974). Environmental Preservation, Uncertainty, and Irreversibility. Quarterly Journal of Economics, 88, 312-319.
Arthur, J. (1994). Effects of Human Resource Systems on Manufacturing Performance and Turnover. Academy of Management Journal, 37 (4), 670-687.
Audibert, M. (1986). Agricultural non-wage production and heath status // Journal of Development Economics, 24.
Babina, Yu. V. (1996). Regional problems of economic regulation of integrated environmental management. Moscow.
Bartelmus, P, Stahmen, C. & Van Tongeren, J. (1981). Integrated environmental and economic accounting: framework for a SNA satellite system. Review of Income and Wealth, 37.
Bartelmus, P, Stahmer, S. & Van Tongeren, J. (1991). Integrated Environmental- Economic Accounting: Structure for SNA satellite system. Review of Income and National Wealth, 37 (2), 111-148.
Bateson, G. (2000). Ecology of mind. Selected papers on anthropology, psychiatry and epistemology. Series: Gold Reserves of the World Psychology. Moscow: Smysl.
Beckenbach, F., Hampicke, U. & Shultz, W. (1989). Moglichkeiten und Grenzen der Monetarisierung von Natur and Umwelt [Possibilities and limits of valuing nature and environment]. Schriftereihe des IOW, 20/88. Berlin.
Benveniste, G. (1994). Mastering the politics of planning. Kalantarova, M. (Ed.). Moscow.
Bishop, J. & Allen, J. (1989). The on-site costs of soil erosion in Mali. World Bank Environment Department working paper, 21. Washington DC: The World Bank.
Bishop, J. & Allen, J. (1990). The on-site costs of soil erosion in Mali. World Bank, Environmental Division, Documents and Reports. No.21.
Bobylev, S. N. (1993). Greening economic development. Moscow: MSU Publishing House,
Bobylev, S. N. (1995). Basic concepts of biodiversity economics. Economic valuation of biodiversity. Economics of biodiversity preservation. Russian Ministry of Natural Resources and Environmental Protection. Moscow.
Bobylev, S. N. (1998). How should biodiversity be assessed? Towards sustainable development. Bulletin of the Centre for Environmental Politics. No.5 (9).
Bobylev, S. N. (1999). Economics of biodiversity preservation (Raising the value of nature). Moscow: Nauka.
Bobylev, S. N. (2000). Prioritizing economic value of natural resources in practice. Towards sustainable development. Bulletin of the Centre for Environmental Politics of Russia. Vol. 4(15).
Bond, M. H., Leung, K., Au A,, Tong, K.-K., de Carrasquel, S. R., Murakami F., ... Lewis, R. J. (2004). Culture-level dimensions of social axioms and their societal correlates across 41 cultures. Journal of Cross-Cultural Psychology, 35, 548-570.
Boreiko, V. Ye. (1999). A breakthrough in ecological ethics. Kiev Ecological - Cultural Centre. Series "Wildlife preservation” Kiev.
Bulgakov, S. N. (2009). Philosophy of economy. Platonov, O. (Ed.). Moscow: Institut Russkoi Civilizatsii.
Cadaster Institute. (1994). Proposals for Improvement of the Regulations and Fees for Resource Use in Pervomaisky municipal district, Yaroslavl Region. Yaroslavl: Cadaster Institute.
Cadaster Institute. (1996). Proposals on the Action Plan of Danilov Municipal District Administration for Rational Resource Use and Environmental Protection for 1997-1998. Yaroslavl, Cadaster Institute.
Cadaster Institute. (1997a). Environmental Management for Sustainable Development. Yaroslavl. Cadaster Institute.
Cadaster Institute. (1997b). Results of Monetary Valuation of Natural Resources in Danilov Municipal District, Yaroslavl Region. Yaroslavl: Cadaster Institute.
Cadaster Institute. (2000a). Berendeyevka Environmental Park in the Development of Kostroma: Ecosystem Services Analysis. Report. Fomenko, G. A. (Ed.). Yaroslavl: Cadaster Institute.
Cadaster Institute. (2000b). Development of Regional Matrices of Environmental- Economic Accounting and their Synthesis at the Federal Level. Pilot Comparison of the SEEAs as Exemplified by Four Russian Regions. Yaroslavl: Cadaster Institute.
Cadaster Institute. (2000c). Economic Premises for Preventing Environmental Conflicts as Exemplified by the Ob-Tom Interfluve Area. Report. Fomenko, G.A. (Ed.). Yaroslavl: Cadaster Institute.
Cadaster Institute. (2000e). Substantiation of the Vectors of Social and Economic Development of Local Territories on the Basis of Economic Estimates of Natural Resources Taking Account of the Depletion Factor: Pilot Study in Saratov Region. Fomenko, G. A. (Ed.). Yaroslavl: Cadaster Institute.
Cadaster Institute. (2003). Developing Proposals for More Efficient Use of the Natural Capital of Municipal Districts in Yaroslavl Region (as exemplified by Pervomaisky municipal district). Yaroslavl: Cadaster Institute.
Cadaster Institute. (2005). Report on Research Project "Developing a Local Action Plan for Environmental Protection and Sustainable Development of Pervomaisky Municipal District, Yaroslavl Region". Yaroslavl: Cadaster Institute.
Cadaster Institute. (2006a). Mechanism for Preserving Biodiversity in Kostomuksha Nature Reserve based on Economic Valuation of Natural Resources and Ecosystem Services Fomenko, G.A. (Ed.). Yaroslavl: Cadaster Institute.
Cadaster Institute. (2006b). Report on Research Project "Environmental and Economic Evaluation of Natural Resources and Eco-System Services as a Basis for Efficient Management of SPNAs and Preservation of Biodiversity (as exemplified by Sochi National Park)". Yaroslavl: Cadaster Institute.
Cadaster Institute. (2006c). Report on Research Project "Validation of an Environmental-Economic Accounting System in Ryazan Region as a Basis for Rational Resource Use and Effective Public Environmental Supervision and Control" Yaroslavl: Cadaster Institute.
Cadaster Institute. (2006d). Report on Research Project "Validation of the System of Environmental-Economic Accounting in the Republic of North Ossetia- Alania as a Basis for Rational Resource Use and Effective Public Environmental Supervision and Control". Yaroslavl: Cadaster Institute.
Cadaster Institute. (2007-2009). Report on Research Project 07-Э6-02 "Developing the Methodology of Reporting the Value of Natural Resources in the System of National Accounts". Yaroslavl: Cadaster Institute.
Cadaster Institute. (2008). Report on Research Project for Evaluating the Natural Capital of Tomsk Region. Yaroslavl: Cadaster Institute.
Cadaster Institute. (2010). Report on Research Project 09-У4-04 "Developing a Special-Purpose Program for Organization and Operation of Special Protected Natural Areas of Federal Significance". Yaroslavl: Cadaster Institute.
Cadaster Institute. (2011). Report on Research Project "Developing a Management Plan of Kronotsky State-Owned Nature Biosphere Reserve and Yuzhno- Kamchatsky State-Owned Nature Reserve of Federal Significance". Yaroslavl: Cadaster Institute.
Cadaster Institute. (2012a). Report on Research Project "Developing a Management Plan for Ecological Educational (Including Tourism) Activities at the Sayano-Shushensky State-Owned Nature Biosphere Reserve". Yaroslavl: Cadaster Institute.
Cadaster I nstitute. (2012b). Report on Research Project "Developing a Management Plan for Stolby State-Owned Sanctuary" for the needs of the Federal Budget Establishment Stolby State-Owned Sanctuary. Yaroslavl: Cadaster Institute.
Cadaster Institute. (2014). Report on Research Project "Developing a Research Program and Environmental Monitoring in State-Owned Nature Reserves and National Parks", code 13-Н4-01 Yaroslavl: Cadaster Institute.
Cadaster I nstitute. (2015a). Report on Research Project "Developing Recommended Methods for Preparing Medium-Term (5-year) Management Plans for State- Owned Nature Reserves and National Parks" code 14-12-NIR/01 Yaroslavl: Cadaster Institute.
Cadaster Institute. (2015b). Report on Research Project "Developing Scientifically Grounded Proposals for Educational Tourism in Special Protected Natural Areas of Federal Significance" code 15-12-NIR/02. Yaroslavl: Cadaster Institute.
Capra, F. (2003). The web of life. A new scientific understanding of living systems. Trilis, V.G. (Ed.). Moscow: Sofia Publishing House.
Capra, F. (2004). The hidden connections. Moscow: Sofia Publishing House.
Capra, F. & Luisi, P L. (2014). The Systems View of Life: A Unifying Vision. Cambridge: Cambridge University Press.
Cassirer, E. (2004). The philosophy of the enlightenment. Makhlin, V.L. (Trans.). Moscow.
Concept of improving valuation of Russia's national wealth (Based on advanced methodology and estimates of its individual elements). (2001). Guidance materials of the Russian Federal State Statistics Service. Moscow.
Danilov-Danilian, V. I. (1996). Sustainable development, the future for Russia. Towards sustainable development. Bulletin of the Centre for Environmental Politics of Russia. Мoscow.
Danilov-Danilian, V. I., Gorshkov, V. S., Arsky, Yu. M. & Losev, K. S. (1994). The environment between past and future: The world and Russia. Moscow.
David, P A. (1985). Clio and the Economics of QWERTY. American Economic Review, 75 (2).
David, P A. (2000). Path Dependence, its critics, and the quest for historical economics. Stanford, CA: Economics Department, Working Paper №00-011.
Day, K. & Frisvold, G. B. (1992). Medical research and the management of genetic resources: the case of Taxol. Selected paper, Western Economic Association Conference, San Francisco, CA.
Dixon, J. A., Scura, L. F., Carpenter, R. A. & Sherman, P B. (2000). Economic analysis of environmental impacts. Moscow: Vita-Press Publishing House.
Dixon, J. A., Sherman, P. B. (1991). Economics of protected areas - a new look at benefits and costs. London: East-West Centre, Earthscan Publication Ltd.
Durojaiye, B. (1988). The monetary value of recreation facilities in a developing economy: a case study of three centers in Nigeria. Natural Resources Journal, 28, 315-328.
Economic Assessment of Projects and Policies in Environmental Activities: Recommended Practice. (1995). Manuscript Copyright. OECD/Economic Development Institute of the World Bank, Paris.
Economics and Environment: English-Russian Reference Book. (1996). Мoscow.
Ecosystem Services in Russia. (2015). Vol.1. Land Ecosystem Services: National Report Prototype. Bukvareva, Ye. N., Zamolodchikov, D. G. (Eds.). Moscow.
Environmental Department of Yaroslavl Region & Cadaster Institute. (2013). Report on Environment state and protection in Yaroslavl Region in 2012. Fomenko, G.A. (Ed.). Yaroslavl.
Environmental Institutions in Present-Day Russia. (2010). Fomenko, G. A. (Ed.). Moscow: Nauka.
Environmental Management and Economic Development. (1989). Schramm, G., Warford, J. (Eds.). Baltimore, Johns Hopkins University Press.
European Commission, OECD, United Nations, World Bank. (2013). System of Environmental-Economic Accounting 2012: Experimental Ecosystem Accounting. White cover publication, pre-edited text subject to official editing.
European Environment Agency. (2011). Europe's Environment - An Assessment of Assessments. EEA, Copenhagen. URL: http://www.eea.europa.eu/ru/ publications/otsenka-otsenokokruzhayushtey-2014-sred44b-evrop
Fiinstra, J. (1984). Historical and Natural Monuments and Environment Pollution. Ministry of Housing, Department of Planning and Environment. Leidschendam.
Final report on agreement for monetary assessment of natural resources in Yaroslavl Region. (1997). Yaroslavl-Moscow.
Fomenko, G. A. (1996). Territorial Differentiation of Fees for the Use of Natural Resources and Environment Pollution in Environmental Management. Bulletin of the Russian Academy of Sciences, 3.
Fomenko, G. A. (1999). Land Relations and Valuation of Russia's Natural Resources. Proceedings of Open Parliamentary Hearings.
Fomenko, G. A. (2000). Environmental Institutional Changes and Price Space. Yaroslavl: Cadaster Institute.
Fomenko, G. A. (2011). The Green Economy as a Way Out of the Global Financial and Economic Crisis. Formation and Implementation of Environmental Policy at Regional Level: 5th Conference Proceedings, 2, 3-8. (December 8-9, 2011). Gushchin, A. G. (Ed.). Yaroslavl, Yaroslavl State Pedagogical University Publishing House.
Fomenko, G. A. (2014). Socio-CulturalDimension of Development of Environmental Institutions. Yaroslavl: Cadaster Institute.
Fomenko, G. A. (2017). Environmental Management: A Socio-Cultural Methodology. Institute for Sustainable Innovation, San Jose.
Fomenko, G. A. & Fomenko, M. A. (1998). Monetary Estimates of Environmental Resources at Micro-Level for Regional Development Management. Growth Centres and Poles in Regional Development: Collection of Articles, 117-122. Lipets, Yu. G. (Ed.). Moscow.
Fomenko, G. A. & Fomenko, M. A. (1999). Drinking Water Supply for the Rural Population of Yaroslavl Region. Bulletin of the Russian Academy of Sciences, Geography Series, Geography Series, 2.
Fomenko, G. A. & Fomenko, M. A. (2007). Development of the System of Special Protected Areas in Russia: Institutional Dead End or Reformation. Inherited Social and Economic Structures and Transition to Post-Industrial Society: Collected articles, 82-96. Institute of Geography with the Russian Academy of Sciences, International Academy of Regional Development and Cooperation. Moscow.
Fomenko, G. A. & Fomenko, M. A. (2016). Changing the Management Approaches to Special Protected Areas for their Integration in the Social and Economic Development of Regions. Voprosy Geografii, 143.
Fomenko, G. & Fomenko, M. (2018). Economic Transition and Environment Protection: Socio-Cultural Aspects. Costa Rica: Institute for Sustainable Innovation.
Fomenko, G. A., Fomenko, M. A. & Mikhailova, A. V. (2006). Economic Mechanisms for Biodiversity Conservation in the Operation of Pleshcheevo Lake National Park. Yaroslavl: Cadaster Institute.
Fomenko, G. A., Fomenko, M. A., Arabova, Ye. A. & Ladygina, O. V. (2013). Problems and Prospects of Developing an Accessible Statistical Base for Accounting and Valuation of Natural Resources. Problemi Regionalnoi Ecologii, 1,75-86.
Fomenko, G. A., Fomenko, M. A. & Loshadkin, K. A (1998). Opportunities for Increasing Economic and Social Benefits in the Resource Sector of Yaroslavl Region with Minimization of Environmental Damage: Project Report. Yaroslavl: Cadaster Institute.
Fomenko, G. A., Fomenko, M. A. & Loshadkin, K. A (2000a). Monetary Assessment of Natural Resources and Ecosystem Services in Territorial Development: Adaptation of the UN Approaches in Russia. Recommended Practice. Yaroslavl: Cadaster Institute.
Fomenko, G. A., Fomenko, M. A. & Loshadkin, K. A (2000b). Monetary Valuation of Natural Resources and Environment Objects: Adaptation of the UN SEEA Methods in Russia (Recommended Practice). Yaroslavl: Cadaster Institute.
Fomenko, G. A., Fomenko, M. A., Loshadkin, K. A & Mikhailova, A.V. (2002). Monetary Assessment of Natural Resources, Objects, and Ecosystem Services in Managing Biodiversity Conservation: Regional Experience. Manual for Experts. Yaroslavl: Cadaster Institute.
Fomenko, G. A., Fomenko, M. A., Loshadkin, K. A. & Arabova, Ye. A. (2016). Recommended Methods for Economic Valuation of Timber and Hunting Resources (as Non-Cultivated Biological Resources) Pursuant to the SNA 2008 and SEEA 2012 Approaches. Yaroslavl: Cadaster Institute.
Fomenko, G., Fomenko, M., Markandya, A. & Perelet, R. (1997a). Natural resource accounting for the oblast of Yaroslavl in the Russian Federation. Environment Discussion Paper, NIS-EEP Project, 35. Harvard Institute for International Development. Harvard University.
Fomenko, G. A., Fomenko, M. A., Markandya, A. & Perelet, R. A. (1997b). Natural Resources of Yaroslavl Region: Report on the Studies of 1996-1997, Yaroslavl - Moscow.
Fomenko, G. A., Fomenko, M. A., Mikhailova, A. V. & Mikhailova, T. R. (2010). Economic Valuation of Special Protected Areas of Kamchatka: Practical Outcome and its Significance for Biodiversity Conservation (as exemplified by Bistrinsky Nature Park) Fomenko, G.A. (Ed.). Yaroslavl: Cadaster Institute.
Fomenko, G. A., Fomenko, M. A., Terentiev, A. A. & Arabova, Ye. A. (2016). Measuring Inclusive Green Growth: Peculiarities and Problems. Problems of Regional Ecology, 5.
Fomenko, G. A., Fomenko, M. A., Troitskaya, N. I., Stishov, M. S. & Mikhailova, A.V. (2015). Systemic Development of Research and Environmental Monitoring in Russian Special Protected Areas of Federal Significance: Program Documents. Fomenko, G. A. (Ed.). Yaroslavl: Cadaster Institute.
Fomenko, G. A. & Fomenko, V. G. (2013). Institutional Factors of Environmental Institutions: as Exemplified by Mechanisms for Reducing Environmentally Unfriendly Output. Formation and Implementation of Environmental Policy at the Regional Level: Proceedings of the 6th All-Russia Conference, 216-222. Yaroslavl: Pastukhov Academy Publishing House.
Fomenko, G. A., Romashkina, G. N., Gordonov, M. Yu., Fomenko, M. A. & Arabova, Ye. A. (2010). Development of Monetary Accounting for Natural Resources in Russia. VoprosyStatistiki, 9, 32-43.
Fomenko, M. A. (1997). Some Features of Territorial Resource Use Planning at Local Government Level in Modern Russia. Bulletin of the Russian Academy of Sciences, Geography Series, 1.
Fomenko, M. A. (2010). Environmental Planning in Local Government. Environmental Institutions in Present-Day Russia, 334-348. Moscow: Nauka.
Fomenko,G. A., Fomenko, M. A. & Mikhailova, A. V. (2006). Sochi National Park: Economic Framework for Biodiversity Conservation. Yaroslavl: Cadaster Institute.
Galbraith, J. K. (1999). The fair society. A humanistic view. A new postindustrial wave in the west anthology. Inozemtseva, V.L. (Ed.). Moscow: Academia.
Gavrilov, V. P. & Ivanovsky, S. I. (1997). Land rent and land valuation. Valuation practice development and creation of the unified system of property valuation in the Russian Federation: 1st All-Russian Conference "Valuation of national wealth". Moscow.
Gibbons, D. (1986). The economic value of water. Resources for the future. Washington D.C.
Glomsrod, S. & Rosland, A. (1988). Air Pollution and Material Damage: Social Costs. Report 88/31. Norway: Central Bureau of Statistics.
Gnedenko, Ye. D., Gorbunova, Z. V. & Strukova, Ye. B. (1998). Chudovo - A socioeconomic analysis of preventive behavior and willingness of the population to pay for reducing potential environmental health risks from drinking water. Moscow - Novgorod.
Gofman, K. G. (1977). Economic assessment of natural resources in a socialist economy. Moscow: Nauka.
Gold, J. (1990). Psychology and geography: An introduction to behavioral geography. Moscow: Progress.
Golub, A. A. & Strukova, Ye. B. (1995). Environmental economics. Moscow: Aspect Press.
Golub, A. A. & Strukova, Ye. B. (1998). Economics of natural resources. Moscow: Aspect Press.
Golub, A., Markandya, A. & Strukova, Ye. (1995a). Rent income and fees for using natural resources in transition economies. HIID Working Papers.
Golub, A., Markandya, A. & Strukova, A. (1995 b). Rental incomes and fees for natural resource use in an economy in transition: the case of Russia. Harvard Institute for International Development (HIID) discussion paper. Moscow: HIID.
Gusev, A. A. (1995). Environmental economics: From the past to the present and future. Economics and mathematical methods. Vol. 31, (4).
Hofstede, G. (1980). Culture's consequences: Intern Differences in work-related values. Beverly Hills.
Hofstede, G. (1997). Lokales Denken, globales Handeln. Kulturen, Zusammenarbeit undManagement. Munchen.
Hofstede, G., Hofstede, G.J. & Minkov, M. (2010). Cultures and Organizations. New York: McGraw-Hill Publishing.
Hooting, R. (1989). National Income Adjustment Due to Environmental Losses: Practical Solution.
Hosle, V. (1993). Philosophy and Ecology. Moscow: Nauka (translation).
House, R. & Hanges, Р. (1999). Cultural influences on Leadership and Organizations. Project GLOBE. Advances in Global Leadership, 1, 171-233.
Huenting, R. (1980). New Scarcity and Economic Growth. More Welfare through Less Production? Amsterdam, New York, Oxford: North Holland.
Husted, B. W. (2005). Culture and Ecology: A Cross-National Study of the Determinants of Environmental Sustainability. Management International Review, 45 (3), 349-371.
Immler, H. (1990). Vom Wert der Natur: Zur oekologische Reform von Wirtschaft und Gesellschaft Natur in der oekonomische Theorie. Vol. 3,2. Berlin: Westdeutsche Verl.
Improvement of Economic Efficiency of the Kursha Bar State-Owned National Park: scientific report. (2000). Yaroslavl: Cadaster Institute.
Inglehart, R. (1990). Culture Shift in Advanced Industrial Society. Princeton, NJ: Princeton Univ. Press.
Inglehart, R. (1997). Modernization and postmodernization: Cultural economic and political change in 43 societies. L.: Princeton; N. J., Princeton University Press.
Inglehart, R. (1999). Trust, well-being and democracy. Democracy and Trust, 88120. Warren, M. (Ed.). New York and Cambridge: Cambridge University Press.
Inozemtsev, V. L. (1999). Civilization split apart. Moscow: Academia-Nauka.
International Panel on Climate Change. (1996). Second assessment report. Working Group III. Cambridge: Cambridge University Press.
Jimenez, E. (1983). The magnitude and determinants of home improvement in self-help housing: Manila's Tondo project. Land economics, 58, 70-83.
Johansson, P. О. (1990). Valuing environmental damage. Oxford Review of Economic Policy, 6 (1), 34-50.
Jonas, H. (1984). The imperative of responsibility: (In search of an ethics for the technological age). Chicago; L.: Univ. of Chicago press.
Jonas, H. (2004). The imperative of responsibility in search of an ethics for the technological age. Makhankov, I. I. (Trans., Ed.). Moscow: IRIS Press.
Kahneman, D. (2014). Thinking. Fast and slow. Moscow: ACT.
Kahneman, D., Slovic, P. & Tversky, A. (2005). Judgment under uncertainty: Heuristics and biases. Kharkov: Institute of Applied Psychology Publishing House.
Kameneva, I. & Martinov, A. (1995). Economic benefits of recreation using the biological resources of Moscow Region. Biodiversity preservation economics. Russian Ministry of Natural Resources and Environment. Moscow.
Kane, J. & Osantowski, R. (1981). An evaluation of water re-use using advanced waste treatment at a meat packing plant. Proceedings of the 35th Industrial Waste Conference, 617-624.
Kasianov, P.V. (1998). Transition to sustainable development: Environmental- economic prerequisites. Moscow: Research Centre at the Russian Environmental Agency.
Kazeltsev, M. & Markandya, A. (1997). Pollution charges in Russia: the experience of 1990-1995. Controlling pollution in transition economies. Bluffstone, R., Larson, B. (Eds.). Cheltenham, UK: Elgar.
Kopp, R. J. (1992). The role of natural assets in economic development. Resources, 106, 7-10.
Ladd, J. (1975). The ethics of participation. Participation in politics. N.Y.: Afherton-Lieber.
Laszlo, E. (1997). Creative paths of human evolution. Report at the December Session of the Budapest Club. Budapest.
Liebowitz, S.J. (2002) Re-thinking the Network Economy: The True Forces that Drive the Digital Marketplace. New York: AMACOM.
Loshadkin, K. A. (2001). Water supply for the rural population during transformation of the geo-economical space. Yaroslavl: Cadaster Institute.
Lukianchikov, I. M. & Potravny, I. M. (2000). Environmental economics and organization. Moscow: Troika.
Lukianchikov, I. M. (1999). Economic and organizational mechanism of environment and resource management. Moscow: NIA-Priroda.
Luty, A. A. (1985). Problems of cartography theory: Concepts and their integration. Bulletin of the Russian Academy of Sciences. Geography Series, 4, 116-132.
Luty, A. A. (1988). The language of the map: Essence, system, functions. Мoscow: Institute of Geography, Russian Academy of Sciences.
Lutz, R. (1988). Sieben Zukunftszenarien: Plane fur eine menschlicheZukunft. Hrsg. von R. Lutz; Mit Beitr. von M.A. Grisebach. Weinheim; Basel: Beltz.
Lvov, D. S., Moiseev, N. N. & Grebennikov, V. G. (1996). On a concept of social and economic development for Russia. Economics and mathematical methods. Vol. 32 (3).
Magrath, W. & Arens, P. (1989). The costs of soil erosion on Java: a natural resource accounting approach. The World Bank Environment Department working paper №18. Washington, D.C.: World Bank.
Markandya, A. (1996a). Green accounting in Europe: Four case studies. European Commission, DGXII. Brussels.
Markandya, A. (1996b). International experience of creating information systems in environmental management. Accounting and socio-economic assessment of natural resources: Collection of regulatory documents. Department of Economics and Finance, Russian Ministry of Natural Resources. Moscow: Russian Ministry of Natural Resources.
Markandya, A. (1997). Mechanisms of Conservation Activity and Resource Management. Environmental management for sustainable development. Yaroslavl: Cadaster Institute.
Markandya, A., Fomenko, G. A., Fomenko, M. A., Perelet R. A. & Loshadkin K. A. (1999). Accounting of natural resources in Russia: Research studies in Yaroslavl Region. Yaroslavl: Cadaster Institute.
Markandya, A. & Pearce, D. W. (1991). The environment and the social rate of discount. The World Bank research observer, 6 (2), 137-152.
Martinov, A. S., Artyukhov, V. V., Vinogradov, V. G. (2000). Sustainable Development and Priorities of Environmental Investment in Russian Regions, Expert System. Towards Sustainable Development. Bulletin of the Centre for Environmental Politics,5 (16).
Meadows, Don., Meadows, Den., Randers, J. (1999). Limits to Growth; Beyond the Limits: Global Catastrophe or Stable Future? A New Postindustrial Wave in the West. Anthology. Inozemtseva, V. L. (Ed.). Moscow.
Medvedeva, O. Ye. (1995). Economic Benefits of Recreation Using the Biological Resources of Moscow Region. Biodiversity Preservation Economics. Russian Ministry of Natural Resources and Environment. Moscow.
Medvedeva, O. Ye. (1998). Methods of Economic Assessment of Biodiversity. Assessment Theory and Practice. Moscow: Dialog-MSU.
Mikhailova, A. V. Geographical Features in Regulation of Environmental Activities at Local Level. Fomenko, G. A., Volkova, I. N. (Eds.). Yaroslavl: Cadaster Institute, 2007.
Millennium Ecosystem Assessment: Synthesis Report. (2005).Washington-London: ISLAND PRESS.
Natural resource economics: policy problems and contemporary analysis. (1986). Ed. D.W. Bromley. Boston: Kluwer Nijhoff Publishing.
Nicolas of Cusa. (1937). Selected Philosophical Works. Moscow.
Nicolas of Cusa. (1979). The layman: About mind. Moscow: Mysl Publishing House.
North, D. (1 997). Institutions, Institutional Change and Economic Performance. Moscow: Centre for Evolutionary Economics of the Russian Academy of Sciences (translation).
Organisation for Economic Co-operation and Development. (1989). Environmental policy benefits: monetary valuation. Study prepared by Pearce, D. W., Markandya, A. Paris: OECD.
Organisation for Economic Co-operation and Development. (1995). The economic appraisal of environmental projects and policies: a practical guide. Paris.
Organisation for Economic Co-operation and Development. (2009). Measuring Capital: OECD Manual.
Organisation for Economic Co-operation and Development. (2011a). Towards green growth: A summary for policy makers.
Organisation for Economic Co-operation and Development. (2011b). Towards green growth: Monitoring progress. Online: http://dx.doi. org/10.1787/9789264111356-en
Organisation for Economic Co-operation and Development. (2011c). Towards Green Growth: Monitoring Progress: OECD Indicators.
Organisation for Economic Co-operation and Development. (2014). Measurement Methodology and OECD Green Growth Indicators.
Orlov, V. P. (2001). Resource-Based Economy under Globalization. Prirodno- Resursniye Vedomosti, 2 (57).
Park, H., Clifford, R. & Junsoo, L. (2007). National Culture and Environmental Sustainability: A Cross-National Analysis. Journal of Economics and Finance, 31 (1), 104-120.
Pearce, D. & Turner, K. (1990). Economics of Natural Resources and the Environment. Harvester Wheatsheaf, Great Britain.
Pearce, D., Markandya, A. & Barbier, Е. (1989). Blueprint for a Green Economy. London, UK: Earthscan Publications Limited.
Peng, Yu-Shu & Lin, Shing-Shiuan. (2009). National Culture, Economic Development, Population Growth and Environmental Performance: The Mediating Role of Education. Journal of Business Ethics, 90, 203-219.
Perelet, R. A., Fomenko, G. A. (1997). Elaboration of International Approaches to Monetary Valuation of Natural Resources. Towards Sustainable Development, Bulletin of the Centre for Environmental Politics of Russia, 2 (6), 20-152.
Perelet, R. A., Fomenko, G. A. (1999). Basics of Integrated Environmental-Economic Accounting of Natural Resources. GIS Association. Newsletter, 4(21).
Perelet, R. A., Lyapina, A. A. (2000). Social Capital and Environmental Protection Issues. Towards Sustainable Development, Bulletin of the Centre for Environmental Politics of Russia, 4 (15).
Peters, C., Gentry, A. & Mendelsohn, R. (1989). Valuation of an Amazonian rainforest. Nature, 339, 655-656.
Pinedo-Valquest, M., Zarin, D. & Jipp, P (1992). Economic returns from forest conversion in the Peruvian Amazon. Ecological Economics, 6, 163-173.
Preobrazhensky, A. B., Fomenko, G. A., Fomenko, M. A., Loshadkin, K. A., Arabova, Ye. A. (1999). Recommended Methods for Monetary Valuation of Environmental Resources in Kaluga Region. Yaroslavl: Cadaster Institute; Kaluga: Cadaster Centre.
Pricing the European Environment. (1992). Navrud, S. (Ed.). Oslo: Scandinavian University Press.
Privalovskaya, G. A. (1999). Resource Use in Present-Day Russia. Bulletin of the Russian Academy of Sciences, Geography Series, 3, 13-21.
Proposals for Introducing Environmental Territorial Accounting in Pervomaisky municipal district, Yaroslavl Region. (1998). Yaroslavl: Cadaster Institute.
Proposals for Using Forest Resources of the North-East of Yaroslavl Region (as exemplified by Pervomaisky municipal district). (2001). Yaroslavl: Cadaster Institute.
Putin, V. V. (2000). Mineral and Energy Resources in the Development Strategy of the Russian Economy. Russia in the Surrounding World: 2000: Analytical Yearbook.
Randall, A. & Stoll, J. R. (1983). Existence value in a total valuation framework. In Managing air quality and scenic resources of national parks and wilderness areas. Rowe, R. D., Chestuns, L. G. (Eds.) Boulder: Westview Press, 265-274.
Ratanova, M. P, Ostapenko, L. S. (1995). Economic Valuation of Biological Resources in Pereslavl State-Owned Natural and Historical Park. Economics of Biodiversity Preservation. Russian Ministry of natural Resources and Environmental Protection. Moscow.
Review of Basic Provisions of Updated System of National Accounts 1993 (SNA 2008) and Proposals for their Implementation in the Statistics of CIS Countries. (2009). Voprosy Statistiki, 11.
Ricoeur, Р (1980). Le conflit des interpretations Essais d'hermeneutique. Dordrecht: Kluwer.
Russel, C. S. (1970). Industrial water use: Technical report to the National Water Commission. Section 2. Springfield VA.
Russian Federal State Statistics Service. (2000). Recommended Practice for Derivation of Monetary Estimates of the Stock of Natural Resources Pursuant to
SNA Requirements: Guidance Materials of the Russian Federal State Statistics Service. Moscow.
Russian Ministry of Natural Resources and Environmental Protection. (1994a). Collection of Regulatory and Procedural Documents on Compiling a Federal System of Natural Resource Cadasters of Territories. Moscow: Logus.
Russian Ministry of Natural Resources and Environmental Protection. (1994b). Provisional recommended methods for compiling integrated natural resource cadasters of territories. Moscow.
Russian Ministry of Natural Resources and Environmental Protection. (1995). Economics of Biodiversity Preservation. Moscow.
Russian State Committee for Land Policy. (2000). Recommended Practice for the State Cadastral Valuation of Farm Land at the Sub-Federal Level. Moscow.
Sadokhin, A. P (2006). Concepts of Modern Natural Science: Textbook for Students in Humanities, Economics and Management. 2nd edition, text revision. Moscow: UNITI-DANA.
Salah, E. S. (1989). The proper calculation of income from depletable natural resources. In environmental accounting for sustainable development: selected papers from joint UNEP/World Bank Workshops. Ahmed, Yu., Salah, E. S., Lutz, E. (Eds.) Washington,
Salah, E. S. (1991). Natural resources accounting: an overview. In development research: the environmental challenge. Ed. Winpenny, J. London: Overseas development institute.
Schulz, W. & Wicke, L. (1987). Der okonomische Wert der Umwelt. Zeitschrift fur Umweltpolitik und Umweltrecht, 10, (2), 109-155.
Schutz, A. (2004). Selected Works: The World Emanating Meanings. Moscow.
Schwartz, S. H. (1992). Universals in the content and structure of values: Theory and empirical tests in 20 countries. Advances in experimental social psychology, 25, 1-65.
Schwartz, S. H. (1994a). Are there universal aspects in the content and structure of values? Journal of Social Issues, 50, 19-45.
Schwartz, S. H. (1994b). Beyond Individualism-Collectivism: New cultural dimensions of values. Individualism and collectivism: Theory, method and applications, 85-119. Kim, U., Triandis, H. C., Kagitcibasi, C., Choi, S-C., Yoon, G. (Eds.) Newbury Park.
Sedjo, R. A. (1992). Property rights, genetic resources, and biotechnological change. Journal of law and economics, 35.
Serafy, S. El. (1989). The proper calculation of income from depletable resources. Ahmad, Y. J., Serafy, El. S., Lutz, E. (Eds.). A United Nations Environment Program - World Bank Symposium. Washington, D.C.: World Bank.
Serafy, S. El, Lutz, E. (1989). Environmental Accounting for Natural Resources. Environmental Management and Economic Development. Schramm, G., Warford, J.(Ed.). Baltimore, Johns Hopkins University Press.
Shashlova, N. V., Fomenko, G. A., Fomenko, M. A., Terentiev, A. A. (2015). Compilation and Use of the System of Environmental Estimates and Green Growth Indicators in the Russian Federation. Joint System of Environmental Information and Green Growth Regional Seminar for the Countries of Eastern Europe, Caucasus and Central Asia. Paris, France.
Stepanitsky, V. B., Troitskaya, N. I. (2002). Nature Reserves and the National Parks Management System: Strengths and Weaknesses. Summary Report at WWF Final Meeting to assess the efficiency of Russian PNA Management, May 13, 2002. Natural Reserves and National Parks, 39, 22-52.
Strukova, Ye. B. (1995). Payments and Tax Receipts from Mineral and Energy Resources. HIID Working Papers.
Sudiev, N. G., Novikov B. N. (1976). Forestry Handbook for Forest Operators. Moscow: Lesnaya Promishlennost.
Survey Report on Modernization in the World and in China (2001-2010). (2011). Lapin, N. I. (Ed.). Preface by Lapin, N. I., Togunyan, G. A. Moscow: Ves Mir Publishing House.
System of Environmental-Economic Accounting for Energy Resources. (2015). System of National Accounts 2008. (2009). New York.
System of National Accounts 2008. (2012). New York.
Tatarinov, A. A. (2014). Environmental Statistics and Environmental Accounts. Report at the Statistics Meeting at the Russian Academy of Sciences, February 24, 2014. URL: www.gks.ru/free_doc/new_site/rosstat/sec/tez_ Tatarinov.docx.
The concept of a system of special protected natural areas of federal importance for the period until 2020. (2011). Approved by the Russian Government on December 22, 2011, No.2322-r.
The Economics of Ecosystems and Biodiversity. (2009). The Economics of Ecosystems and Biodiversity for National and International Policy Makers. Summary: Responding to the Value of Nature.
The World Bank. (1995). Economic Policy and Environment. Washington, DC.
The World Bank. (1997). Five years after Rio. Innovations in Environmental Policy. The World Bank toward environmentally and socially sustainable development.
Tishkov, A. A. (2000). Project of the Global Environmental Facility Trust Fund for Biodiversity Conservation. Towards Sustainable Development. Bulletin of the Centre for Environmental Politics of Russia, 5 (16).
Tobias, D., Mendelsohn, R. (1991). Valuing ecotourism in a tropical rain-forest reserve. AMBIO, 20, 91-93.
Toynbee, A. (1995). Civilization on Trial. Moscow-St.Petersburg (translation).
Triandis, H.C. (1995). Individualism and collectivism. Coulder, Colorado: Westview Press.
Trompenaars, F., Hampden-Turner, C. (2004). National Culture Differences in the Context of Global Business. Minsk.
Turner, K., Bateman, I., Pearce, D.W. (1993). Environmental Economics. Baltimore: John Hopkins Press.
United Nations Economic Commission for Europe. (2007). Environmental Monitoring: Guidelines for the Application of Environmental Indicators in Eastern Europe, Caucasus and Central Asia.
United Nations Environment Programme. (1989). Environmental accounting for sustainable development. Ahmad, Y. J., El Serafy, S., Lutz, E. (Eds.). Washington, D.C.: World Bank.
United Nations Environment Programme. (2011a). Towards a Green Economy: Pathways to Sustainable Development and Poverty Eradication: Synthesis Report for Decision Makers. Online: www.unep.org/greeneconomy.
United Nations Environment Programme. (2011b). Towards a Green Economy: Pathways to Sustainable Development and Poverty Eradication.
United Nations Statistical Division. (1993). SNA. Regional integrated environmental indicators development. Integrated environmental and economic accounting. New York.
United Nations Statistics Division. (2007). Global Assessment of Environment Statistics and Environmental-Economic Accounting.
United Nations. (1984). A Framework for the Development of Environment Statistics: Statistical Papers, Series M, 78.
United Nations. (1988). Concepts and methods of environment statistics: Statistics of human settlements: A technical report. Studies in methods. Series F, No.51.
United Nations. (1991). Concepts and methods of environment statistics: Statistics of the natural environment. A technical report. Studies in methods. Series F, No.57.
United Nations. (1992). Revised System of National Accounts, Provisional. (ST/ESA/ STAT/SER.F/2/Rev.4).
United Nations. (1993a). Handbook of National Accounting: Integrated Environmental-Economic Accounting.
United Nations. (1 993b). Handbook of National Accounting: Integrated Environmental and Economic Accounting. Interim version. Series F, 61. Online: http://unstats.un.org/unsd/publication/SeriesF/SeriesF_61E.pdf.
United Nations. (1994a). Integrated environmental-economic accounting:
Handbook of national accounting. New York.
United Nations. (1994b). Integrated environmental-economic accounting.
Provisional version. Studies in Methods. Series F, No.61. New York.
United Nations. (1998). Integrated Environmental and Economic Accounting. New York.
United Nations. (2000a). Integrated Environmental and Economic Accounting an Operational Manual. Studies in Methods. Series F №78. Handbook of National Accounting. New York.
United Nations. (2000b). Integrated environmental-economic accounting: An operational manual. New York.
United Nations. (2003). Handbook of National Accounting: Integrated
Environmental-Economic Accounting.
United Nations. (2012a). Central Framework of the System of Environmental- Economic Accounting.
United Nations. (2012b). System of Environmental-Economic Accounting. New York (translation).
United Nations. (2012c). The future we want. Outcome document of Rio+20 conference on sustainable development [Online] URL: http://rio20.net/wp- content/uploads/2012/06/N1238164.pdf
United Nations. (2014). System of Environmental-Economic Accounting 2012 - Central Framework. New York. URL: http://unstats.un.org/unsd/ envaccounting/seeaRev/SEEA_CF_Final_en.pdf.
United Nations, European Commission, International Monetary Fund, Organization for Economic Cooperation and Development, World Bank. (2003). Integrated Environmental and Economic Accounting.
United States Agency for International Development. (1988). Guidelines for conducting willingness-to-pay studies for improved water services in developing countries. Water and Sanitation for Help project (WASH) field report №306.
United States Environmental Protection Agency. (1983). The acidic deposition phenomenon and its effect: Critical assessment review papers. Altshuller, A. P, Linthurst, R. A., Niemeyer, L.E. et al. (Ed.). Vol. 1: Atmospheric Sciences, ЕРА- 600/8, РВ 84-171644. USA.
Ushakov, Ye. P, Okhrimenko S. Ye., Okhrimenko Ye. V. (1999). Valuation of Major Natural Resources: Recommended Methods. Moscow: ROO.
Vachon, S. (2010). International Operations and Sustainable Development: Should National Culture Matter? SustainableDevelopment,18, 350-361.
Warhurst, A. (1994). Environmental degradation from mining and mineral processing in developing countries: corporate responses and national policies. Paris: OECD.
Weizsaecker, E., Lovins, A. & Hunter, L. (1999). Factor Four doubling wealth. A new postindustrial wave in the west. Anthology. Inozemtseva, V.L. (Ed.). Moscow.
White, G. (1990). Geography, Resources and Environment. Moscow: Progress (translation).
Whittington, D. (1990). Estimating the willingness to pay for water Services in developing countries: a case study of the use of contingent valuation surveys in Southern Haiti. Economic Development and Cultural Change, 38, 293-311.
Williams, G., Zinkin, J. (2008). The effect of culture on consumers' willingness to punish irresponsible corporate behavior: applying Hofstede's typology to the punishment aspect of corporate social responsibility. Business Ethics: A European Review, 17(2), 210-226.
World Bank. (1992a). Guidelines for Environmental Assessment: Technical Document of the World Bank No. 139. Washington.
World Bank. (1992b). Guidelines for Environmental Assessment: Technical Document of the World Bank No. 154. Washington.
Yablokov, A. V. (2000). Problems and Prospects of Environment Protection in Russia (from the Report on behalf of the Round Table Discussion of Environmental Organizations at the All-Russia Extraordinary Conference on Environment Protection, Moscow, June 13). Towards Sustainable Development. Bulletin of the Centre for Environmental Politics of Russia, 4 (15).
Yaroslavl Regional Committee for Statistics. (1997). Yaroslavl Region Statistical Yearbook. Yaroslavl.
Young, R. A., Gray, S. (1972). Economic value of water: concepts and empirical estimates. Technical report to the National Water Commission, NTIS NO PB210356. Springfield.
Zakharov, V. M. (2000). Environmental health: Concept. Moscow: Centre for Environmental Politics of Russia.
Zakharov, V. M., Baranov, A. S., Borisov, V. I., Valetsky, A. V., Kryazheva, E. K., Chistyakova, E. K. & Chubinishvili, A. T. (2000). Environmental health: Valuation methods. Moscow: Centre for Environmental Politics of Russia.
Founded in 2016, Institute for Sustainable Innovation (ISI) promotes sustainability of organizations, enterprises, and communities worldwide by proving innovative research, consulting, training, and publishing services. Located in San Jose, Costa Rica, ISI is a member of the Resources and Consulting group of companies.
Additional information is available at: www.isi-cr.com
An institutional unit is an economic entity which is capable, in its own right, of owning assets, incurring liabilities, engaging in economic activities and entering into transactions with other entities (SNA, 2012, chapter 4 paragraph 4.2).
Institutional sectors in the SNA are groups of similar institutional units (SNA, 2012, chapter 4, paragraph 4.16). All institutional units refer to one of the five institutional sectors:
- non-financial corporations;
- financial corporations;
- public government;
- non-profit organizations serving households;
- households (SNA, 2012, chapter 4 paragraph 4.24).
For example, according to the SEEA paragraph 5.346, timber resources may be inaccessible if they are: 1) in areas where forest harvesting operations are restricted or prohibited; 2) in remote or inaccessible areas, i.e., where harvesting is not profitable; 3) not biologically suitable for inclusion among commercially harvested wood species. Resources inaccessible for procurement do not have economic value but they are still in the scope of the SEEA in physical terms, because they meet the definition of environmental resources and can be used to generate profit.
However, having no economic value, such resources are not recorded in the asset accounts for timber resources in monetary terms. It is therefore necessary to provide a clear definition of the scope of timber resources in physical terms in order to ensure proper correspondence between accounts in physical and monetary terms (paragraph 5.347).